Finding Runtime Errors with the Novell exteNd Workbench Debugger
Articles and Tips: article
01 Sep 2003
Adapted from the Novell exteNd Workbench 4.1Tools Guide
Novell exteNd Workbench Debugger is a valuable tool to help you find runtime errors in your Java applications. This Developer Note talks about the Debugger and shows how you can use it to debug both server and client applications.
|
Topics |
debugging, Java programming, J2EE application, programming techniques |
|
Products |
Novell exteNd Workbench 4.1 |
|
Audience |
Web application developers |
|
Level |
intermediate |
|
Prerequisite Skills |
familiarity with Java programming |
|
Operating System |
none |
|
Tools |
none |
|
Sample Code |
no |
Introduction
The Debugger included in Novell exteNd Workbench 4.1 helps you find runtime errors in your Java applications by controlling and monitoring the execution of Java code. You can debug server-side objects (such as J2EE applications) and client-side objects, either on a local host machine or remotely on distributed machines.
By default, when you launch a debugger from within Workbench, the exteNd Debugger is launched. If you want to use a different debugger, you can specify that debugger so it is launched from within Workbench. (This will be explained later in this Developer Note.)
This Developer Note talks about the exteNd Debugger and shows how you can use it to debug server and client applications, manage program execution, and analyze the behavior of your application.
Terms You Should Know
Before you use the exteNd Debugger, you should review the following terms.
Breakpoint. You can set a breakpoint on an executable line in your code where you want execution to stop temporarily. When you set a breakpoint in code, the program stops running before executing the line containing the breakpoint, then turns control over to the Debugger.
Deadlock. A deadlock is a condition that occurs when two processes are each waiting for the other to complete before proceeding. Both processes hang.
Instance variable. An instance variable is a field declared within a class declaration without using the keyword static.
Local variable. A local variable is declared inside a particular method. Only code that is contained in the method can access a local variable.
Monitor. In Java, a monitor is an exclusive lock on an object. Locks are used in thread synchronization. When a method is programmed to be synchronized, it cannot be run in multiple threads concurrently. When a synchronized method is entered, it acquires a monitor on the current object (the object whose method was called). The monitor prevents other synchronized methods in the object from executing. When the synchronized method returns, its monitor is released, allowing other synchronized methods in the same object to run.
Thread. A thread is a single execution stream in a program. Java is a multithreaded language, which means that you can have many execution streams operating at one time. In Java, threads are represented by the Thread object.
About the Debugger
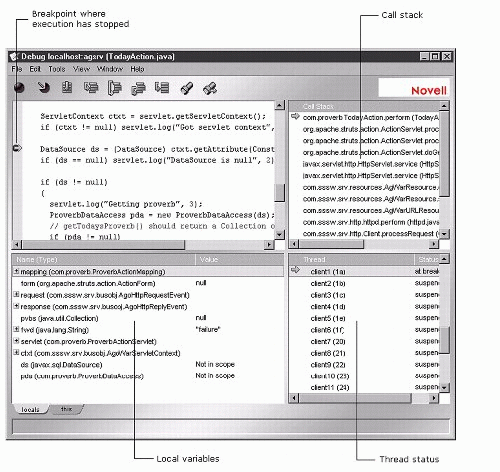
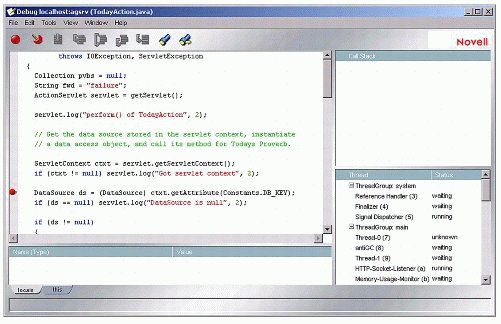
The exteNd Debugger provides several capabilities for diagnosing problems with your Java applications. Figure 1 is a sample Debugger window, showing many of its features.
Figure 1: Example Debugger window.
With the exteNd Debugger, you can debug both client and server objects, including objects in deployed J2EE applications (such as servlets and JSP pages, Enterprise JavaBeans, and other Java code in deployed J2EE archives) and other Java applications executing on a server. You can also troubleshoot Java applications running on a local host or remotely in a distributed network. You can configure a process to be debugged either on the local machine or on a remote machine, but not for both in the same session.
There are many situations that require remote debugging--for example:
The Java application runs error-free on some machines but not others in a network, requiring you to debug the application while it runs on the problematic remote system.
The application runs in a network where the server is in a remote location.
The application must be tested on a remote machine that does not have the resources to run the Debugger locally.
The Debugger provides methods for exercising your code by:
Setting and managing breakpoints in Java application source code
Stepping in, out, and over source code
Running applications to a location in source code marked by the cursor
Running applications to the next breakpoint
Suspending and resuming threads
To help you isolate problems in source code, the Debugger provides viewers for examining variables, the call stack, and thread status at any point in program execution.
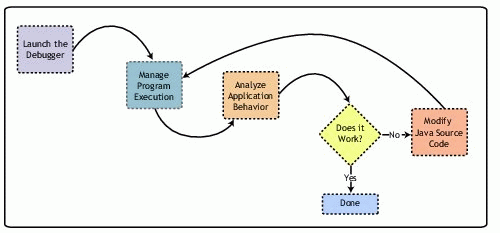
Although each debugging session poses its own unique challenges, you typically follow the workflow shown in Figure 2 when troubleshooting applications.
Figure 2: Debugging workflow.
The techniques you use to debug applications running on a server as opposed to client applications are different. The next two sections describe the techniques for debugging server and client applications.
Debugging Server Applications
If you are debugging objects running on a server (such as J2EE applications), you should start the application on your server and then attach the Debugger to that application, rather than trying to start the application from the Debugger. You can debug applications running on any J2EE application server supported by Workbench.
Starting the Server
In some cases, you must start your application server in debug mode before you can debug server objects. This section provides instructions for starting the Novell exteNd Application Server for debugging. (For further details about starting this and other application servers in debug mode, consult the documentation for the server.)
Starting the exteNd Application Server for Debugging. The steps to start the Novell exteNd Application Server for debugging are listed below.
Note: The following instructions apply to both the SilverStream eXtend Application Server and the Novell exteNd Application Server.
start the server with one of the following options:
|
Command
|
Description
|
|
+debug |
Starts the server for local debugging, using the default debug address "agsrv". |
|
+debug:suspend=y |
Suspends the JVM at startup. Use the Continue command in the Debugger to resume execution. This option is helpful for debugging initialization code that would normally get executed before the Debugger is attached. |
|
+debug:suspend=n |
(Default) Does not suspend the JVM at startup. |
|
+debug:address=debug_address |
Lets you specify the debug address to use. |
|
+debugremote |
Starts the server for remote debugging, using the default debug port 9901. |
|
+debug:port=port_num |
Starts the server for remote debugging, using port_num instead of the default debug port 9901. Use this option if port 9901 is not available. |
As an example, this command line launches the exteNd Application Server for local debugging:
ServerInstallDir\bin\SilverServer +debug
This command line launches the exteNd Application Server for remote debugging:
ServerInstallDir\bin\SilverServer +debugremote
For instructions on how to start the WebLogic server for debugging, see the Novell exteNd Workbench 4.1 Tools Guide included with the product.
Launching the Debugger
You can launch the Debugger from the command line or from within Workbench. To launch the Debugger from the command line, follow these steps:
Make current the WorkbenchInstallDir\bin directory.
If debugging an application on a local server, enter:
SilverDebugger -attach localhost debug_address

 If debugging an application on a remote server, enter:

 SilverDebugger -attach machine_name:debug_port
Open files you want to debug in the Debugger, set breakpoints, then run your application.
To launch the Debugger from Workbench, follow these steps:
Select Edit > Launch Debugger. You will see the dialog box shown in Figure 3.
Figure 3: Launching the Debugger.
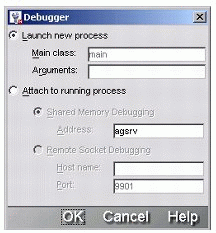
Select "Attach to running process".
If debugging an application on a local server, select "Shared Memory Debugging" and provide the debug address. If debugging an application on a remote server, select "Remote Socket Debugging" and specify the machine name and debug port.
Open files you want to debug in the Debugger, set breakpoints, then run your application.
A Sample Debugging Session
In the following scenario, you'll see how to debug ProverbFinal, the J2EE application that is built in Workbench's Web application tutorial. The scenario shows debugging the application on a local application server. (This application is provided as a Workbench project. For details, see "Tutorials" in the Workbench help.)
Start the local server in debug mode:
ServerInstallDir\bin\SilverServer +debug
Open the ProverbFinal project in Workbench. The project is in WorkbenchInstallDir\docs\tutorial\ProverbFinal. It is a completed application.
Deploy the application to the server. In this scenario the application was deployed to ProverbsCloud, the Cloudscape database provided with the tutorial.
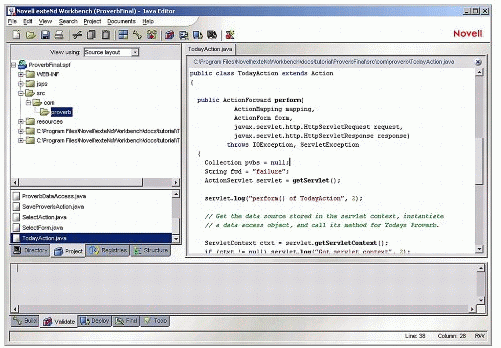
Open the file to be debugged. If you have a file open when you launch the Debugger from Workbench, that file opens in the Debugger automatically. You can also open other files in the Debugger to debug them.
Figure 4 shows the TodayAction.java file opened. This code is executed when someone asks to see today's proverb.
Figure 4: TodayAction.java file open.
Select Edit > Launch Debugger to start the Debugger.
Select "Launch new process" and specify "main" as the class. Because the application server was started using the default debug address, "agsrv" is specified as the debug address. The Debugger opens and displays the file.
Set a breakpoint on a line of code by placing the cursor on the line and clicking the Toggle Breakpoint icon in the Debugger toolbar, as shown in Figure 5.
Figure 5: The Toggle breakpoint button.
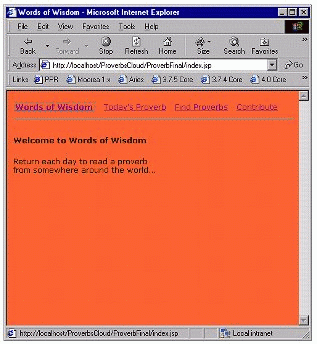
To run the application, open a browser and specify this URL:
http://localhost/ProverbsCloud/ProverbFinal/index.jsp
You will see the main application window as shown in Figure 6.
Figure 6: Proverbs application.
Click Today's Proverb. This action invokes code in TodayAction.java. Execution stops (you will see that the browser has not completed processing the page), and the Debugger window is updated (see Figure 7).
Figure 7: Updated Debugger window.
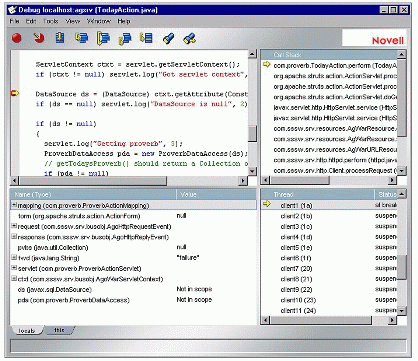
You can see that the execution arrow is at the breakpoint.
At this point, step through the code, looking at variable values, the call stack, and so on, as described in the rest of this Developer Note.
When you have finished debugging, continue execution by clicking the Continue icon. The page completes execution.
Debugging J2EE Applications
Using the techniques shown in the preceding sample debugging session, you can debug your J2EE applications. You debug EJBs and servlets exactly as shown above: open the source code for the EJB or servlet in the Debugger, set one or more breakpoints, then run your application.
To debug a JSP page, which is translated and compiled into a servlet for execution, you need to locate the Java source file that the server created from the JSP page, open the source file in the Debugger, and set your breakpoints. Different J2EE servers will locate their source files differently. (For information about other servers, consult their documentation.)
The exteNd Application Server locates its generated source files in its compile cache. To find the Java source files the application server generated from deployed JSP pages, look in this directory:
ServerInstallDir/compilecache/server/database/temp/sources/application/com/sssw/gen/jsp
For example, to find the source file corresponding to today.jsp (shown above), look in:
ServerInstallDir/compilecache/localhost/ProverbsCloud/temp/sources/ProverbFinal/com/sssw/gen/jsp
You will see a set of Java files corresponding to the JSP pages that the server translated into servlets. Files will be named name_jsp_nnnnnnnnnn.java.
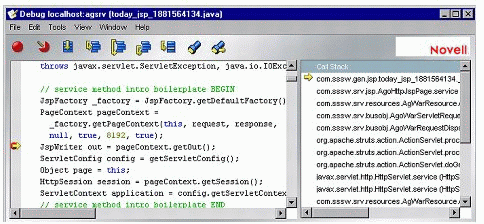
Figure 8 shows an example of a JSP source page open to the Debugger. Here, execution has stopped in the Java source file generated from today.jsp.
Figure 8: JSP source page open to the Debugger.
Debugging Client Applications
In addition to debugging J2EE applications and other applications running on application servers, you can also use the Debugger to debug client Java applications. When debugging client applications, you can do either of the following:
Invoke the Debugger to start the application
Attach the Debugger to a running application
Invoking the Debugger to Start the Application
You can start an application from the command line from within Workbench. To start a client application from the command line, follow these steps.
Make current the WorkbenchInstallDir\bin directory.
Enter the following at the command line:
SilverDebugger [options] class class_arguments
Here are the SilverDebugger arguments for launching an application:
ArgumentDescriptionoptions
-sourcepath directory_list The list of the directories (separated by semicolons) the Debugger searches for source files (these directories must be source tree roots)
-sourcefile filename The fully qualified name of the Java source file to display in the Debugger
-? Usage information for the SilverDebugger command
-classpath directory_list The list of the directories (separated by semicolons) the Debugger searches for Java classes used in the application
-Dname=value A system property setting for the application environment
-Xoption A JVM option forthe application environment
class
The name of the class to debug
class_arguments
Arguments to pass to the main() method of class
Note: If your source and class files reside on remote network machines, specify paths and filenames using Universal Naming Convention (UNC) format:\\server-name\shared-resource-pathname
The Debugger opens on your desktop, displaying the Java source file specified.
Set one or more breakpoints in your code or in exceptions.
Select Tools > Continue from the menu or click the Continue icon in the toolbar of the Debugger window. The application opens on your desktop, and execution stops at the first breakpoint encountered.
Attaching to a Running Application
You can start the application and then attach the Debugger to it. To do this, you must start the application specifically for debugging. To attach the Debugger to a running Java application, follow these steps.
Launch the Java application either on the local host or ona remote machine.
To launch the application on a local host, type this command on the command line (the option "transport=dt_shmem" specifies shared-memory transport, which is required for local debugging):
java -Xdebug -Xnoagent
-Xrunjdwp:transport=dt_shmem,server=y,suspend=n
-classpath classpath classname
The JVM returns a debug address. For example:
c:\jdk1.3.1_01\demo\jfc\Notepad>java -Xdebug -Xnoagent -Xrunjdwp:transport=dt_shmem,server=y,suspend=n
-classpath . -jar Notepad.jar
Listening for transport dt_shmem at address: javadebug
In this example, the JVM returns "javadebug" as the debug address. Note this debug address; you must pass it to the Debugger in Step 2.
To launch the application on a remote network machine, type this command on the command line (the option "transport=dt_socket" specifies socket-based transport, which is required for remote debugging):
java -Xdebug -Xnoagent
-Xrunjdwp:transport=dt_socket,server=y,suspend=n
-classpath classpath classname
The JVM returns a debug port number. For example:
c:\jdk1.3.1_01\demo\jfc\Notepad>java -Xdebug -Xnoagent -Xrunjdwp:transport=dt_socket,server=y,suspend=n
-classpath . -jar Notepad.jar
Listening for transport dt_socket at address: 3340
In this example, the JVM returns 3340 as the debug port. Note this debug port number; you must pass it to the Debugger in Step 2.
Invoke the Debugger either from the command line or from within Workbench. At the command line, use the appropriate SilverDebugger command. For local debugging, type:
SilverDebugger -attach localhost debug_address

      where debug_address is the address returned by the JVM in Step 1.

      For remote debugging, type:

      SilverDebugger -attach machine_name:debug_port

      where debug_port is the port number returned by the JVM in Step 1.
To invoke the Debugger from within Workbench, select Edit > Launch Debugger, then select "Attach to running process". If debugging locally, select "Shared Memory Debugging" and specify the debug address returned by the JVM in Step 1. If debugging remotely, select "Remote Socket Debugging" and specify the debug port returned by the JVM in Step 1.
Open a source file for debugging using File > Open.
Managing Program Execution
Once you have started the Debugger, there are several ways to manage program execution to allow you to isolate and diagnose problems in the source code:
Using breakpoints
Continuing execution
Stepping through the code
Using Breakpoints
You use breakpoints to specify lines in your code where you want to stop execution and give control to the Debugger. When the code stops executing and the Debugger takes control, you can execute Debugger commands and view the call stack, thread status, and variable values.
You can set breakpoints only on individual lines in your code. If a line contains multiple statements, you can set a breakpoint only on the first statement in the line. To set breakpoints on the subsequent statements, you need to break up the line so that each statement appears on its own line.
Note: Breakpoints are stored by server name and class name. As a result, like named objects on the same server share breakpoints.
Setting and Removing Breakpoints in Code.There are several ways to set and remove breakpoints in code, either for local classes or classes loaded from external sources. If the Debugger cannot find the source code, it prompts you for a path. This section describes the procedures for setting and removing breakpoints in source code.
To set breakpoints in code using Toggle Breakpoint:
Put the cursor at the line in the source code where you want to set a breakpoint.
Either choose Tools > Toggle Breakpoint from the menu or select the Toggle Breakpoint icon in the Debugger toolbar. The breakpoint indicator appears in the left margin beside the line you specified.
To set breakpoints in code using the Edit menu:
Select Edit > Show Line Numbers from the menu. This makes it easier to specify locations for breakpoints.
Choose Edit > Breakpoints from the menu. The Manage Breakpoints dialog opens.
Select the Code tab. The dialog lists all breakpoints that have been set.
Click Add.
To insert a breakpoint in your local Java class, in the Specify breakpoint field, enter the location where you want to add a breakpoint, in the form <fully qualified class name>:<line number> (for example, com.myapp.gui.CheckBoxes:99) and click OK.
To insert a breakpoint in your loaded classes, click Browse, navigate to the method where you want to insert a breakpoint, and click OK. The breakpoint specification appears in the Specify Breakpoint field.
The new breakpoint appears in the Manage Breakpoints dialog.
Click OK.
Click Done to add the breakpoint to the source code.
To remove individual breakpoints using Toggle Breakpoints:
Click in a line that has a breakpoint.
Select the Toggle Breakpoint icon in the Debugger toolbar.
To remove breakpoints using the Edit menu:
Choose Edit > Breakpoints from the menu. The Manage Breakpoints dialog opens.
Select the Code tab and click to select the breakpoints you want to remove.
Click Delete. The breakpoints disappear from the list in the ManageBreakpoints dialog.
Click Done. The breakpoints disappear from the source code.
To remove all breakpoints, select Tools > Clear All Breakpoints from the menu or click the Clear All Breakpoints icon in the Debugger toolbar.
Setting and Removing Breakpoints in Exceptions.In addition to setting breakpoints in the main body of source code in your Java applications, you can set breakpoints in standard Java exceptions or in exceptions that you write to handle specific behaviors. This capability can help you pinpoint the source of exceptions that are thrown unexpectedly when you run your application. When you set a breakpoint in an exception and then run your application, the Debugger will stop where the exception gets thrown and display the offending source code if it is available for the class you are debugging. If the Debugger cannot find the source code, it prompts you for a path.
To set breakpoints in exceptions:
Choose Edit > Breakpoints from the menu. The Manage Breakpoints dialog opens.
Select the Exception tab and click Add. The Add Exception Breakpoint dialog opens.
Type the fully qualified name of the exception class on which you want to break, or click Browse to select an exception from the list of loaded exceptions.
Click OK to return to the Manage Breakpoints dialog. The new breakpoint is listed.
Click Done. (Note: Exception breakpoints do not appear in the source code.)
To remove breakpoints from exceptions:
Choose Edit > Breakpoints from the menu. The Manage Breakpoints dialog opens.
Select the Exception tab and click the breakpoints you want to remove.
Click Delete. The breakpoints are removed from the list.
Click Done.
Enabling and Disabling Breakpoints.The Debugger allows you to enable and disable breakpoints in code and exceptions. Disabled breakpoints appear with a grayed icon. To enable and disable breakpoints:
Select Edit > Breakpoints from the menu. The Manage Breakpoints dialog opens.
Select the Code or Exception tab to locate the breakpoints you want to enable or disable.
Click the breakpoints you want to activate and click Enable or Disable. To select multiple breakpoints, hold down the Ctrl or Shift key when you click each choice.
Click Done. The breakpoints you selected will be enabled or disabled when you continue program execution.
Continuing Execution
When the program stops at a breakpoint, you can continue execution using the Continue or Run to Cursor commands in the Debugger. Use the Continue command to resume running the program to the next breakpoint it encounters. Use the Run to Cursor command to continue running the program to a specified location in the code, marked by the cursor.
When the program reaches a breakpoint, the Debugger window is activated and an arrow (called the execution pointer) appears in the margin to the left of the code indicating which line is about to be executed. Along with the execution pointer, the Debugger displays a list of local and instance variables and enables the commands for stepping through your code.
To continue to the next breakpoint, select Tools > Continue from the menu or click the Continue icon in the toolbar of the Debugger window. The Debugger executes your source code until it reaches the next breakpoint.
To run to a specified location in the source code:
Click in the line of code where you want execution to stop. The cursor must be located on a line that contains executablestatements.
Select Tools > Run to Cursor from the menu or click the Run to Cursor icon in the toolbar of the Debugger window. Run to Cursor executes your code from the current execution location until it reaches the place where the cursor is located. If you have breakpoints set and a line containing a breakpoint is executed before the line that has the cursor, Run to Cursor stops execution at that breakpoint line.
Note: If you put the cursor on a line that doesn't get executed--for example, if your cursor is on the first line of code inside an if statement when the if condition evaluates to false--the effect of executing Run to Cursor will be the same as if you select the Continue command.
Stepping Through the Code
There are three Step commands included in the exteNd Debugger:
|
Command
|
Executes
|
Details
|
|
Step Over |
The current line |
If the current line contains a method call, that method is executed. The Debugger stops at the line immediately following the line that was executed. |
|
Step In |
The current line |
If the current line contains a method call, the Debugger stops at the first line in the called method. Otherwise, the Debugger stops at the line immediately following the line that was executed.If the Debugger cannot find the source code for the method it has entered, it prompts you for a path, as described in "When the Debugger Cannot Locate Source Code." |
|
Step Out |
The remainder of the current method |
The Debugger stops at the statement immediately following the statement that called the current method. |
When the Debugger Cannot Locate Source Code
When the Debugger cannot locate source code for a particular operation, it prompts you to provide the path to the source file. Either provide the path or dismiss the prompt and follow directions to either continue execution or step out of the current method.
Analyzing the Behavior of the Application
You can examine the current execution state at three points: when the Debugger stops at a breakpoint, following a Step command, and when you suspend and resume threads. At each of these points you can view the following information:
Call stack
Thread status
Local and instance variables
Viewing the Call Stack
The Debugger provides a viewer that lets you examine the call stack during program execution. The call stack viewer shows the name of each method in the stack, along with its source file and line number. When you double-click a method in the call stack viewer, the source file opens in the Debugger,highlighting the line where the method is called. If the Debugger cannot find the source file, it prompts you for a path.
The call stack viewer updates the call stack when:
The Debugger stops at a breakpoint.
You execute a Step command.
You continue execution to the next breakpoint.
You continue execution to a specific location in the code, marked by the cursor.
You select a different thread.
To open the call stack viewer, in the Debugger, choose View > Call Stack from the menu. A pane for viewing the call stack appears in the Debugger window.
Viewing Threads
The Debugger provides a viewer that lets you examine the status of threads during program execution. The thread viewer displays threads organized by groups, showing the name of each thread along with its identifier and state. You can suspend and resume threads to isolate problems that occur in thread synchronization, such as deadlocks and infinite loops.
The thread viewer updates thread status when:
The Debugger stops at a breakpoint.
You execute a Step command.
You continue execution to the next breakpoint.
You continue execution to a specific location in your code, marked by the cursor.
You suspend and resume threads.
To open the thread viewer, in the Debugger, choose View >Threads from the menu. A pane for viewing threads appears in the Debugger window.
Interpreting Thread States.Threads can exhibit a variety of states during program execution:
At breakpoint - the thread was running when execution stopped at the breakpoint.
Running - the thread is running.
Sleeping - The thread is sleeping for a specified period of time.
Suspended - The thread is suspended.
Waiting - The thread is waiting for notification to resume running.
Waiting on monitor - The thread is waiting for a monitor to be released by another thread. (In a deadlock situation, you will see two or more threads in this state. However, threads that appear in this state do not necessarily indicate a deadlock.)
Suspending and Resuming Threads. If you encounter an infinite loop or deadlock in a thread, you can isolate the problem by suspending the thread and viewing its call stack. You cannot view the call stack of a thread unless it is suspended.
To suspend a thread and view its call stack:
Open the thread and call stack viewers.
To suspend all threads, stop execution of the code at a breakpoint. Click the suspended thread. To suspend an individual thread, double-click a running or waiting thread in the thread viewer.
The call stack for the selected thread appears in the call stack viewer.
Double-click methods in the call stack to view their code in the Debugger. If you double-click a waiting thread, the method that put the thread in a waitstate appears in the call stack viewer. If the Debugger cannot locate the source code for a method you selected, it prompts you to supply a path.
To resume all threads suspended at a breakpoint, resume execution of your application by one of the following methods:
Stepping in, out, and over source code
Running the application to a particular location in the source code, marked by the cursor
Running the application to the next breakpoint
Continuing execution
To resume an individual thread, double-click the suspended thread in the thread viewer.
Viewing Variables
The Debugger provides a viewer that lets you examine local and instance variables when program execution stops at a breakpoint. The variable viewer displays the variable name, type, and value. The variable viewer updates variable values when:
The Debugger stops at a breakpoint.
You execute a Step command.
You continue execution to the nextbreakpoint.
You continue execution to a specific location in your code, marked by the cursor.
To open the variable viewer, in the Debugger, choose View > Variables from the menu. A pane for viewing variables appears in the Debugger window. Click locals to view local variables and click this to view instance variables for thecurrent object.
Conclusion
This Developer Note has introduced the Novell exteNd Debugger that is available with Novell exteNd Workbench 4.1. For more detailed information on using the Debugger, see the Help files associated with the product. For general information about the Novell exteNd family of Web application development tools, see http://www.novell.com/extend.
* Originally published in Novell AppNotes
Disclaimer
The origin of this information may be internal or external to Novell. While Novell makes all reasonable efforts to verify this information, Novell does not make explicit or implied claims to its validity.