SERVER MEMORY:Tuning Cache with the NetWare 4 LRU Sitting Time Statistic
Articles and Tips: article
01 Mar 1995
If you're interested in tuning your NetWare 4 server, the file cache is a great place to start. This document describes how the cache works and outlines a step-by-step process you can use to tune the cache and measure your success.
File Cache Theory of Operations
NetWare's file caching subsystem is a pool or collection of 4 KB memory pages. After loading the OS, system NLMs, and application NLMs, NetWare initializes all remaining memory as the file cache pool.
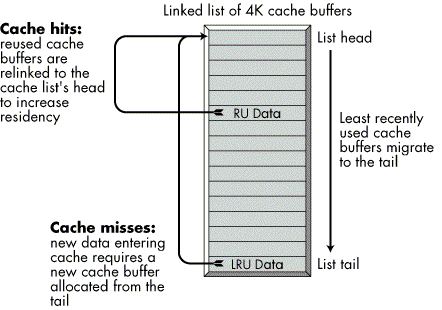
File cache memory is organized using a data structure called a linked list (see Figure 1). At the beginning of the list is the "list head," where new cache buffers are inserted into the list. The end of the list is the "list tail," where old cache buffers are removed from the list. Each cache buffer in the list is linked to the next cache buffer, and each one includes a time stamp indicating the time the cache buffer was inserted into the list head.
When the server receives a disk I/O request for data that is not currently in cache (a cache "miss"), the data is read from the disk and written into one or more cache buffers that are removed from the list tail. Each newly filled cache buffer is time-stamped with the current time and linked into the list head. A newly filled cache buffer is designated as the most-recently-used (MRU) cache buffer because it has resided in cache for the least amount of time.
Figure 1: File cached linked list.

A cache "hit" - a frequent event in NetWare environments - occurs when a disk request received by the server can be serviced directly out of cache, rather than from disk. In this case, after the request is serviced the cache buffer containing the requested data is removed from the list, time-stamped with the current time, and relinked into the list head. In this manner, MRU cache buffers congregate at the head of the list. This characteristic of the list is important to understand, because you want your MRU cache buffers to remain cached in anticipation of repeated use and repeated cache hits.
At some point in this process, the file cache pool becomes full of recently used data. This is where the least-recently-used (LRU) cache buffer comes into play. LRU cache buffers are buffers that were originally filled from the disk, but haven't been reused as frequently as the MRU cache buffers at the list head. Due to the relinking of MRU cache buffers into the list head, LRU cache buffers congregate at the list tail. When new cache buffers are needed for data requested from disk, NetWare removes the necessary number of LRU cache buffers from the list tail, fills them with newly requested data, time-stamps them with the current time, and relinks them into the list head.
The resulting NetWare file cache subsystem gives preference to repeatedly used data and holds onto less frequently used data only as long as the memory isn't needed for repeatedly used data.
When tuning file cache, then, the ideal scenario is one in which every repeated use of recently accessed data can be serviced out of cache. This is accomplished by sizing server memory so that the resulting file cache pool is large enough to retain all repeatedly used data. But how can you measure your success? A statistic known as the LRU Sitting Time holds the answer to this previously hidden facet of NetWare file cache efficiency.
LRU Sitting Time
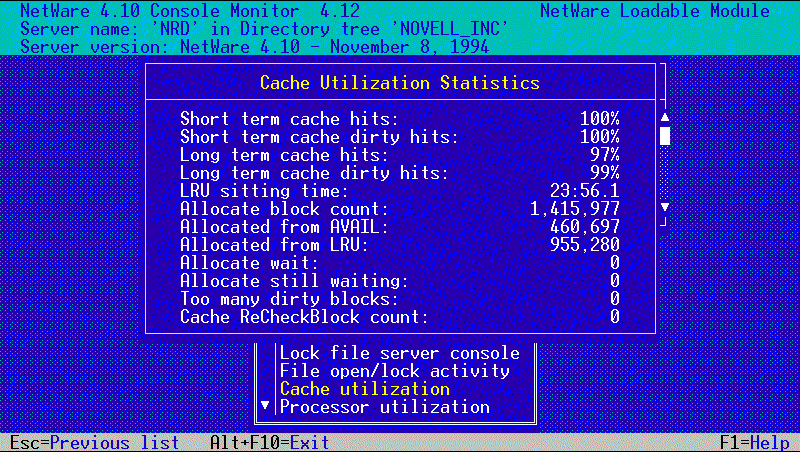
The LRU Sitting Time statistic is updated and displayed once per second in MONITOR.NLM under the Cache Statistics menu (see Figure 2). The statistic is calculated by taking the difference between the current time and the time stamp of the LRU cache block at the tail of the cache list. The result is displayed in HH:MM:SS.0 format (beginning with hours and ending with tenths of a second).
LRU Sitting Time measures the length of time it is taking for an MRU cache buffer at the list head to make its way down to the list tail, where it becomes the LRU cache buffer. One might refer to this measurement as the cache "churn rate" because, whether from cache hits or misses, every cache buffer in the list is being reused within that period of time.
In configurations with an excessive cache, the LRU Sitting Time can be very high, even many hours. At the other extreme, with in-sufficient cache, the LRU Sitting Time can be down in the 10 to 20 second range. The time will vary widely depending on your circumstances.
Figure 2: LRU Sitting Time statistic displayed in MONITOR.NLM's Cache Statistics screen.

A Cache Tuning Strategy
Here's a step-by-step process to help you use the LRU Sitting Time statistic effectively.
1Estimate Server Memory Requirements. Use the current NetWare 3 and 4 Server Memory Worksheet found in the January 1995 issue of Novell Application Notes to estimate your server memory requirements. This estimate is the first step in making sure you've given NetWare sufficient memory resources.
2Determine an Average Think Time. Get to know your user community's applications, the types of loads they place on the server, and how workload patterns change over time and by user type.
Using protocol analysis tools or by inference, determine an average think time for your server's environment. Think time is the period of time that is created when a user workload isn't performing I/O to the server. It can be caused by pauses for creative thinking, phone time during an order-entry process, or use of the distributed processing model in which much of the work is done on cached data at the user's workstation. Think times typically range from several minutes to 12 minutes.
3Track Server Resource Utilization Statistics. Use STAT.NLM (available on NetWire) to track server resource utilization statistics. Chart the results for daily, weekly, monthly, period-end, and year-end cycles. Identify recurring periods of peak workloads.
4Observe Cache Statistics. Monitor the LRU Sitting Time during peak workload periods and at other times of the day. Keep a record of the lowest LRU Sitting Time during your observations for at least one week , longer if necessary to see a consistent pattern.
5Develop a Low Watermark. Based on the knowledge you have gained of your server, users, workload patterns, work cycles, resource utilization statistics, and cache statistic observations, determine your average low LRU Sitting Time. This average becomes your low watermark.
6Tune the Cache. Now you're ready to tune the server's cache. There are several ways to tune server cache for peak efficiency. We'll concentrate on tuning the size of cache here.
We recommend that your cache be sized in such a way that it is able to sustain an LRU Sitting Time low watermark that is equal to or greather than the average think time during peak workloads.
Here's where your homework pays off. If your low watermark is 7 minutes and your average think time is 12 minutes, you'll need to add memory to increase the LRU Sitting Time during those peak workloads. The added memory increases the likelihood that repeatedly used data will still be cached when the next user request is received.
On the other hand, if your LRU Sitting Time low watermark is 18 minutes and your average think time is 8 minutes, you have more than adequate cache resources. In this case, you can leave the excess memory in the server as a buffer for future growth, or you may want to consider removing some memory and using it in another server where it may be more beneficial.
The point is not whether you actually add or remove memory from your server. This information is intended to improve your ability to interpret the LRU Sitting Time statistic and thereby provide you with a meaningful way to understand the efficiency and performance of NetWare's file cache.
* Originally published in Novell AppNotes
Disclaimer
The origin of this information may be internal or external to Novell. While Novell makes all reasonable efforts to verify this information, Novell does not make explicit or implied claims to its validity.