Using Production Workload Characteristics to Validate LAN Performance Evaluation Studies
Articles and Tips: article
Senior Consultant
Systems Research
01 Mar 1993
Many of today's benchmarks are misleading because they're not really testing what you think they're testing. In fact, they shouldn't even be called benchmarks. This AppNote details key production workload characteristics that can be used to validate the usefulness and accuracy of test workloads and benchmarks before you use their results.
Previous AppNotes in This Series May 91 "An Introduction to Workload Characterization" Jul 91 "Workload Characterization of NetWare Clients and Servers Using a Protocol Analyzer" May 92 "Identifying Test Workloads in LAN Performance Evaluation Studies"
- Introduction
- Production Workload Characteristics
- Notable Pattern Characteristics
- Test Workload Analysis and Validation
Introduction
During 1987 and 1988, I was heavily involved in a series of benchmarks with the intention of developing a useful design guide for LANs. During that time, I worked with several component tests such as Novell's PERFORM3, MASTER/TEST, and IPXLOAD, and Innovative Software's LAN Performance Test (LPT). After considerable testing with 100 workstations running on Ethernet, Arcnet, and Token-Ring, I became frustrated with my inability to correlate these test results with a number of actual users, a set of real applications, or anything else that was real. In my estimation, the results were useless because I couldn't show anyone how my results related to their system requirements.
From this experience, I realized that the results I wanted would only come from system tests that use realistic test workloads that closely emulate workloads found in production environments. Soon after, I began a study of production workloads. My goal was to capture, model, and generate test workloads that emulate production workloads and use the results to improve the network design process.
In this AppNote, I describe key production workload character-istics that should be used to validate the realism of any test workload used in LAN performance evaluations.
Definitions
Test workloads can be divided into two classes: component tests and system tests. My definitions for these and related terms are presented here for clarity.
Test Workload: A series of processing requests that exercise the resources of an entire system, subsystem, or component of a system under test.
Benchmark: A test designed to compare and contrast the performance of network components and systems.
A benchmark is more than a test workload. The term benchmark implies the existence of a hypothesis, such as "This system or component is adequate or surpasses my needs." Therefore, test workloads cannot be called benchmarks unless their results represent the satisfaction of real needs.
Component Test Workload: An artificial or synthetic test workload that loads a system component unnaturally.
Characteristics of a component test workload include an unnatural quantity of work and an unnatural workload pattern with no natural delays. The results of component tests have no correlation to any number of real users and do not represent the usage patterns of people using real applications. Such results do not represent the performance of the component or system under test in a production environment and should be used solely for engineering test purposes. For these reasons, component test workloads do not make adequate system test workloads and should not be used for benchmarking.
System Test Workload: A synthetic or real test workload that is designed to stress a complete system naturally, in the same way the system will be stressed in a production environment.
Characteristics of a system test include a natural quantity of work and a natural workload pattern with natural delays. The results of system tests represent the performance of the system under test in the target production environment with a quantifiable number of users of real applications. Therefore, these same results can easily be applied to system design, bottleneck isolation, optimization, and capacity planning projects.
System test workloads do not make very good component tests because they do not allow the flexibility to isolate individual system components unnaturally.
The Need for Validation
In a previous AppNote (see "Identifying Test Workloads in LAN Performance Evaluation Studies" in the May 1992 NetWare Application Notes), I discussed five separate areas where LAN performance evaluation tools are useful:
Product development and testing
Procurement
Design
Optimization
Capacity Planning
In product development and testing, good test workloads do not necessarily include much realism. But in the other four stages of a production system, the correct application of the results hinges solely on the workload's realism. In this context, "realism" means how accurately the workload represents the production workload that the system under test will eventually service.
If you are the designer of a system test or the consumer of system test results, the test workload must prove its realism by exhibiting a high correlation to your target production system's workload. This proof should occur before any decisions are made based upon its results. Otherwise, you risk drawing the wrong conclusions.
For example, some test workloads give the impression that placing four NICs in a server provides better performance than fewer NICs. This would be good information if it weren't for the fact that many servers supporting 250 users are performing adequately with one NIC. In Novell's Superlab, using a realistic test workload, we've determined that in an adequately designed server, two NICs are sufficient during peak loads in database environments supporting up to 250 users. We've also learned that the LAN channel isn't even the initial bottleneckCa conclusion that unrealistic test workloads would overlook completely. This example points out the fallacy of using a component test as a system test.
In other cases, many readers of unrealistic test workload results (including the testers themselves) mistakenly believe that the results are somehow representative and they use them in inappropriate ways.
One of the most frequent abuses of the results is to try to convert the number of test workstations into a number of real users. This error stems from the desire to use the results to design networks for a given number of real users. But the results aren't representative and can't be converted into any numbers that are meaningful to LAN design and optimization processes. Sadly, the converted numbers are even more deceptive because they can be masqueraded as realistic results.
Proving the soundness and realism of a test workload for design purposes requires a knowledge of workload characteristics, especially the workload characteristics that your production environment will support. These are the characteristics that will determine whether a system is more or less than you need to purchase and support.
Production Workload Characteristics
There are two major classifications of characteristics that make up LAN workload: quantity and pattern.
Workload = Quantity + Pattern
During the design of test workloads, the choice of one over the other can be disastrous. Both are equally important ingredients if realism is one of the test's design goals. Both must be present and accurate if the test workload is to pass a test workload analysis.
Quantity
The first and most apparent of workload characteristics is quantity. The moment you attach a protocol analyzer to the network you're, impressed with the great volume of data traveling to and from the network server. Because quantity is the most easily measured, it is the class of characteristics most often simulated by design software and emulated by today's artificial test workloads.
Quantity characteristics include:
Average and peak bytes per second
Average and peak packets per second
Average and peak media utilization
Packet size distribution
Using hardware- or software-based protocol analyzers, you can easily measure these characteristics. But relying on these measurements alone will leave you with an inaccurate picture of the captured workload. A series of packets without the correct pattern is as uninteresting and artificial as using an X as your signature.
Pattern
Pattern is the other major classification of workload characteristics and, by far, the most important. The pattern classification includes:
Delay or time between operations caused by work at the client due to (1) the distributed processing model, (2) suspension of activity, (3) think time, and (4) system overhead.
Ratio of read requests to write requests.
Service request frequency distribution by type (Read From a File, Write To a File, and so on).
Number of file access events by file type: public (shareable, read-only), private (non-shareable, read-write), and database(shareable, read-write).
Number of read and write events by file type.
Number of open files during each unit of work.
Size of files during each unit of work.
Size and frequency of reads and writes by type (sequential reads, random reads, sequential writes, random writes).
Number of Find_next events following Find_first events.
Percentage of the file locked during each unit of work.
These pattern characteristics describe what's really happening on the wire. How long does the user spend in meetings, eating lunch, or thinking between tasks? How large are the user's write requests? Is the read I/O sequential or random? How many Find_next requests is the client OS having to issue to find a particular file?
These are the things that make up workload pattern. And it's these types of workload characteristics that exercise a network server in a much different manner than test workloads based on quantity alone. For this reason, pattern is crucial to any test workload that claims to be realistic.
But, at the same time, pattern characteristics are more difficult to characterize than those of quantity. This is because all commercial protocol analyzers focus on quantity characteristics, error statistics, and other troubleshooting-related data rather than the workload characterization pattern. Every tool that I've heard of that characterizes workload pattern was developed for in-house research by large system vendors such as DEC and IBM. So the technology has been around for many years, but it has never been integrated into a commercial product.
Notable Pattern Characteristics
I present two of the pattern characteristics here in greater detail because they are the two largest contributors to pattern, and the two most neglected ingredients in test workloads.
Delay
Of all workload pattern characteristics, delay is the most prominent. Taking the server's perspective, the majority of active connections produce highly random patterns of request traffic - lengthy periods of delay separated by small bursts of activity. We call this "delay-burst" activity because of the magnitude of idle time in the workload and the infrequent requests for services.
Nearly all workloads exhibit this burst-delay pattern. The exceptions are automated workloads such as reports, very large copies of data from one location to another, and other custom applications that include very little delay.
If you have access to a protocol analyzer, try calculating the number of seconds individual users spend accessing the wire as a percentage of a normal 8 or 10 hour workday. You're likely to find that the percentage is less than one percent.
The four sources of delay that create this delay-burst pattern are:
Inherent delays within the distributing computing model
Suspension of activity
Think time
Process time
Distributed Computing Delays. In the NetWare file service environment, the distributed computing model contributes greatly to the delay time seen between client requests to the server. By far, the majority of the work done by any application is done at the client. Naturally, this takes time, which translates into significant delay.
For example, in file-oriented workloads such as word processing and spreadsheet applications, smaller files are read sequentially from the server and worked on at the client for long periods of time. These types of delays in file-oriented workloads are often better measured in minutes than in seconds or milliseconds.
Record-oriented applications built with database tools exhibit similar delays, but of a lesser magnitude. Record-oriented workloads often demonstrate a greater frequency of service requests than file-oriented workloads, but they still incur a significant delay while work is performed at the client. Each of the several categories of record-oriented workload (data entry, maintenance, automated reporting, query, browsing, and so on) manifests a different, but nonetheless significant, delay pattern.
Suspension of Activity. This source of delay includes such events as lunch time, breaks, meetings, personal time off, and projects that take workers away from workstation-related activities. Instead of a constant workload being placed on the LAN, these delays create patterns in the workload that resemble traditional time and motion studies.
Figure 1 shows an example of this phenomenon. In this case, the peak utilization of the LAN between 9:30 a.m. and 11:30 a.m. was not produced by 250 people working harder, but rather by more of the 250 people accessing the network than at other times of the day.
Figure 1: A typical LAN workload that resembles traditional time and motion studies.
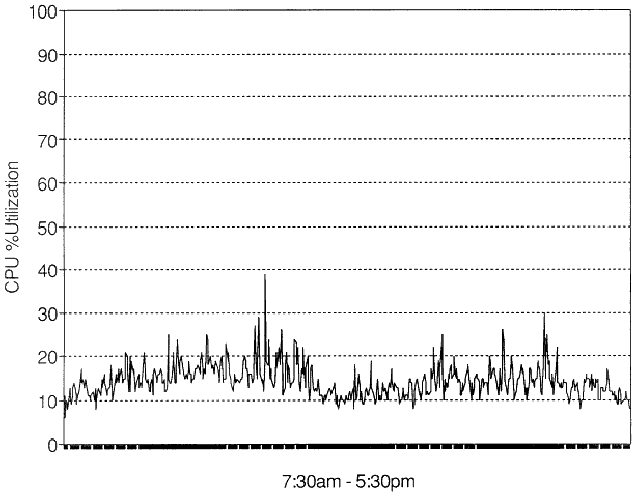
Although suspension-of-activity delays are common in most LAN environments, and a knowledge of them is useful to network managers, performance evaluation studies should focus on the peak periods of resource utilization. Representative test workloads developed for LAN studies should emulate those peaks so that the results reflect a system's performance under load during peak production. In doing so, the test workload developer should ignore all levels below the peak load.
Think Time. Think time is the time spent by the user on tasks that do not create workload: thought, hesitation, collaboration, and so on. These delays are tied directly to the type of application the user is working with, the amount of creativity or problem-solving involved in the project, and interruptions such as phone calls and visits with other workers.
The type of application the user is accessing can have a dramatic effect on the length and frequency of think time-related delay. For instance, delays incurred while a person uses a data entry application will normally be short and will often manifest a more regular pattern of use. Delays of a person using a word processor or spreadsheet (which normally require more thought and creativity) can be much longer.
Process Time. Once an active connection is created between a client and a server, the server may wait a long time for a request. This wait is most often created by think time and suspensions of activity on the part of the person sitting at the workstation. The request/response cycle comes into play when the application requests a series of services without user intervention, such as the reading of a word processing document or the loading of an executable file.
During these kinds of events, there is a delay between the time the server transmits a response to the prior request and the time the server receives another request. I call this "process time." The initial response had to return to the workstation via the network, be read from the network into workstation memory, and be processed by the workstation. The succeeding request had to be formed by the workstation, written to the network, traverse the network, be read from the network, and be processed by the server.
On the one hand, the time required for these processes is insignificant when you consider that current technologies are capable of handling over 1,000 NetWare requests per second. On the other hand, if an accurate representation of this delay is omitted, the resulting test workload will not exercise a server's resources the same way a production workload does.
Using Delay Patterns in Test Workloads. Test workload developers often lose sight of their original goal to design a realistic workload when they see the impact of these delays on their test process. Stressing a server with a realistic test workload containing natural delays takes many more computers than a workload without delay. Consequently, all of the so-called "file server" and "network" benchmarks have either greatly reduced amounts of delay or none at all.
Changing the test workload to make it produce a greater amount of workload involves significant trade-offs. Such changes limit the ability of the test workload to locate accurate bottlenecks because system bottlenecks move as the workload changes from realistic to unnatural. The results from these test workloads also exaggerate the differences between systems under test.
For performance evaluation purposes, I classify all delays of 0.55 seconds up to 12 minutes as think time delays. This decision was based on the workload characterization of over 100 people using a variety of applications. These are the most important delay characteristics to include in a realistic test workload.
Read:Write Ratio
Of all the characteristics, I've found the ratio of reads to writes, to be the most interesting - partly because my findings are contrary to the beliefs commonly held by people in the networking industry.
The read-write ratio is the relation in quantity between network read requests and write requests, expressed as a quotient (either R:W or R/W). With a protocol analyzer, you can capture the numbers required to compute R:W ratios for NetWare clients and servers. (For information and filter specifications, see "Workload Characterization of NetWare Clients and Servers Using a Protocol Analyzer" in the July 1991 NetWare Application Notes).
Once you obtain the total quantity of read requests and write requests for a given time period, you can easily compute the R:W ratio.
The total requests transmitted by a single client provide you with the R:W ratio for that client's application.
The total requests received by a server provide you with the R:W ratio of the workload being serviced by the server.
In some cases, the R:W ratio of a client or server can be as low as 1:1 or as high as 100:1. Most often, however, R:W ratios lie somewhere between those two extremes.
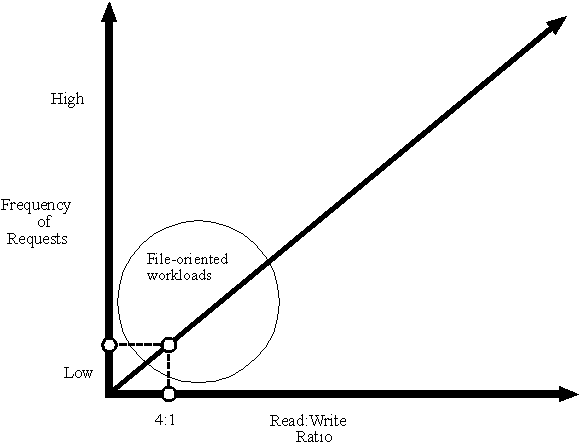
File-Oriented Applications. Interestingly, the workloads generated by word processing applications and other similar applications tend to have low R:W ratios, averaging 4:1. The low ratio of these file-oriented applications also exhibits a strong correlation to their frequency of requests, as shown in Figure 2.
Once a word processing or spreadsheet document is read into client memory, the network doesn't see much activity from that client due to think time and suspension of activity. The exception here - and the cause of the low R:W ratio - is the frequent write activity involved in updates and automated backup processes induced by the application.
Of course, all of this workload (or lack thereof) is transparent and therefore invisible to the user.
Figure 2: Read:Write ratio of file-oriented workloads.
Record-Oriented Applications. Surprisingly, database applications are at the other end of the read:write ratio spectrum. Record-oriented applications and their resulting workloads tend to have higher ratios averaging 24:1. Figure 3 shows the strong correlation between the high R:W ratio and the frequency of requests.
Figure 3: Read:Write ratio of record-oriented workloads.
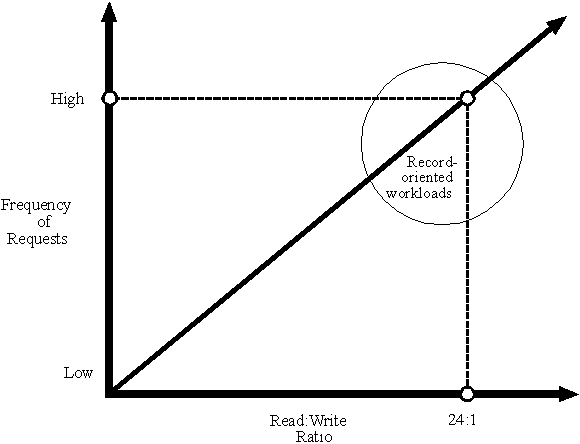
Figure 4 compares these two major classes of workloads. Based on several years of workload characterization research, my conclusion is that record- and file-oriented workloads are at once very different and yet very polarized.
Figure 4: File-oriented and record-oriented applications are at opposing ends of the Read:Write ratio spectrum.
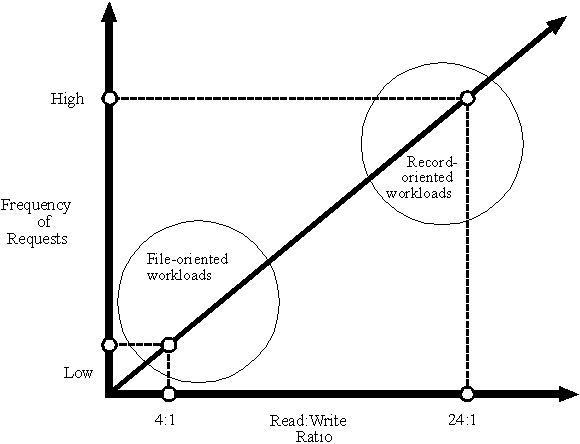
This conclusion points out the need for at least two separate test workloads: one for file-oriented workloads, one for record-oriented workloads, and possibly a third to represent a mixture of both types of workload characteristics.
For instance, one test would allow you to test a system for an accounting department where the majority of applications are record-oriented, and another test could be used to represent the workload of a legal department where the majority of applications are file-oriented.
The difference between file- and record-oriented workloads emphasizes the serious error in using a single test workload to represent both of these important classes of workload characteristics. When the goal of the performance evaluation is to make recommendations concerning one or the other class of workload characteristics, distinct and separate tests should be constructed with accurate representations of the R:W ratio of the production system under design.
Other Pattern-Related Characteristics
Beyond the characteristics of delay and read:write ratio, there are many other characteristics that make up a realistic workload. I've listed just a few under "Pattern" earlier in this AppNote.
As performance evaluation tools mature, they must incorporate an increasing number of these characteristics until the tools have the look and feel of real production workloads. Only then will you be able to make reliable design, tuning, and capacity planning decisions based on their results.
Until then, the usefulness of the results generated with the tools currently available, beyond simple component testing, should be held in question.
Test Workload Analysis and Validation
To validate the correlation between your needs and the information provided by the test workload, you need to perform a Test Workload Analysis (TWA). The first step is to characterize the workload that will be placed on your production system. The second step is the TWA itself, in which you measure and analyze the workload characteristics of the test workload. The final step is a comparison of the two to validate the realism of the test workload.
If the characteristics of the test workload are significantly different than those of your production system, the results of the test will tell you little about the performance of the system under test in your production environment.
Of course, this analysis and validation procedure only works if you currently have a production system to analyze. (If you don't, see "Characteristics for Initial System Design" at the end of this AppNote.)
Step 1: Characterize the Production Workload
To adequately characterize your current workload, you'll need a protocol analyzer. You need to set up a filter that isolates the receive traffic addressed to your server. Then set up individual filters for read requests and write requests. I describe how to do this with a LANalyzer in a previous AppNote (see "Workload Characterization of NetWare Clients and Servers Using a Protocol Analyzer" in the July 1991 NetWare Application Notes).
Run your analysis during the entire work day for a week or two. If applicable, also run the tests during end-of-month processes and other periods of peak activity.
The results of this analysis will give you a good characterization of your workload. You should pay special attention to the following items:
The total number of clients in your user community
Types and usage of applications (record- or file-oriented)
Total volume of workload
Peak periods during the work day
Peak days and other peak periods
Server read:write ratio
Network packet size distribution
Network error frequency
Abnormally high usage patterns of individual clients
A more detailed analysis of your production workload's pattern, including delay and other subtleties, requires a different set of tools that are not readily available. However, you can assume that your production workload is real and natural, because it contains actual delays. The burden of proof is on the test workload, not on your production workload.
Step 2: Analyze the Test Workload
The next step is to run your test workload on a pilot system and perform the same characterization as in Step 1. The most important characteristics to analyze for the test workload are:
Types and usage of applications (record- or file-oriented)
Total volume of workload
Read:write ratio
Packet size distribution
Again, the measurement and analysis of the test workload's pattern requires a different set of tools that are not readily available. However, Novell Research will publish a series of TWAs on the most popular test workloads and benchmarks in future NetWare Application Notes to provide this information.
Step 3: Validate the Test Workload
Once you have the information listed above, the validation process is not difficult. You need to ask the following questions:
Does the test workload generate a delay pattern representing natural think times?
Is the type of application represented by the test workload (record- or file-oriented) the same as those used in your production environment?
Does the test workload allow you to duplicate the volume of workload in your production environment and also to add user workload incrementally for capacity planning?
Is the test workload's read:write ratio similar to your own?
Is the test workload's packet size distribution similar to your own?
If you can answer "yes" to each of these questions, you've found the right test workload for your design, bottleneck isolation, optimization, and capacity planning decisions. If not, you should be very careful how you apply the results of the test workload.
Characteristics for Initial System Design
If you don't have a production system to characterize, or if you're designing a system for a new application set, the validation process is simplified. You should know:
How many clients your server will be supporting
The type of applications (record- or file-oriented) you'll be deploying
These two factors are indexes into Novell Research's Design Guide series that will be published in future NetWare Application Notes.
* Originally published in Novell AppNotes
Disclaimer
The origin of this information may be internal or external to Novell. While Novell makes all reasonable efforts to verify this information, Novell does not make explicit or implied claims to its validity.