A New Version of STAT.NLM
Articles and Tips: tip
Senior Research Engineer
01 Jun 1997
Have you ever watched the CPU Utilization statistic on the MONITOR NLM server console screen? Regardless of the load on the server, the numbers seem to bounce all over, changing value every second in a random sequence such as 25, 2, 2, 45, 90, 90, 22, 0, 0, 0, 0. To make sense of this statistic, you need a graph of CPU utilization over a period of time.
In 1992, Novell Research introduced a tool for collecting performance statistics from a NetWare file server (see "STAT.NLM: A Tool for Measuring NetWare 3.11 Server Resource Utilization" in the March 1992 issue of AppNotes). STAT records the server utilization statistic (and several other performance statistics) in a file so you can graph it. STAT thus enables you to look at utilization trends (the server is mostly unused between 6 p.m. and 6 a.m, utilization nears 100 percent by 10 a.m., drops to 50 percent until 2 p.m., then peaks again until 4 p.m.), as well as characterize the type of server workload (bursty, as with word processing, or level, as with databases). It can also help you diagnose the location of server bottlenecks (memory, network channels, or disk channel).
When NetWare/IntranetWare 4.11 was released, we discovered that STAT no longer ran on it, because STAT uses a couple function calls that were no longer available in the operating system. Fortunately, we had the technology--we could rebuild it. We made it stronger, faster, better.
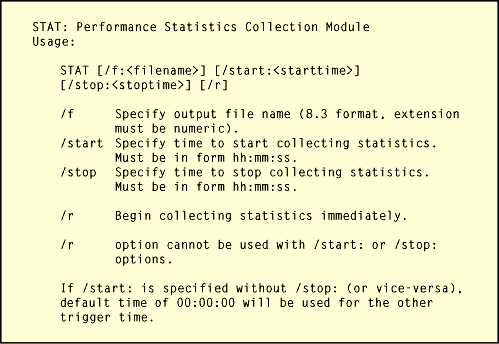
STAT.NLM v4.11 runs on all versions of NetWare and IntranetWare since v3.11. If you have used STAT before, you don't have to forget what you know already. The main difference is that we have added a command-line interface so you can set STAT's options when you load it. This can be really handy if you want to load STAT from the AUTOEXEC.NCF file with a particular set of options, or if you want to start collecting statistics every time you bring up the server. See Figure 1 for STAT's command-line syntax.
Figure 1: STAT.NLM command-line options.

You can set trigger times when STAT starts and stops collecting statistics. For example, you may want to collect statistics only between 7 a.m. and 6 p.m. Each day's statistics are saved in a separate file. By default STAT's data files are named STAT.000, STAT.001, and so on. You can specify a different file name, either on the command line, or on STAT's configuration screen, but the extension must be three numeric digits.
STAT saves its data files in the SYS:SYSTEM directory. The files are in a binary format, so you need another program, DUMPSTAT.EXE, to convert them to a format that can be read by spreadsheet programs or viewed on the screen. Although the old version of DUMPSTAT still works, we wrote a new version. There were only two changes.
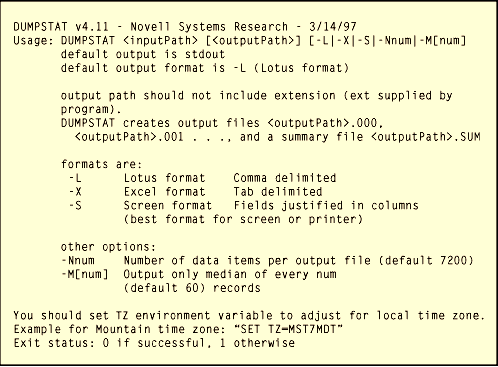
First, DUMPSTAT v4.11 handles errors in the Number of Connections statistic. In some (rare) situations, an error may occur when STAT gets the number of stations in use (essentially the number of users logged in to the server). STAT v4.11 stores an error value in the file for this statistic, but keeps running. The new DUMPSTAT checks for this error value and displays a warning message. Second, DUMPSTAT v4.11 checks the TZ environment variable to correct for time zones. Figure 2 shows DUMPSTAT's command line usage.
Figure 2: DUMPSTAT v4.11 command-line options

Other STAT/DUMPSTAT Features
Besides the options that specify the format that DUMPSTAT is to output, DUMPSTAT also has a useful option to smooth out STAT data. The -M option calculates the median for a specified number of seconds (default 60). This is useful when you want to look at overall trends, rather than every burst of network traffic.
STAT doesn't collect the actual CPU utilization statistic. It actually saves the two statistics NetWare uses to calculate utilization: Number of Polling Loops and Maximum Number of Polling Loops. The Number of Polling Loops statistic is the number of times in a one-second interval that the operating system's polling process executes. The Maximum Number of Polling Loops is the maximum value ever reached by the Number of Polling Loops statistic. STAT collects these two statistics (and 6 others) and saves them in a file. DUMPSTAT calculates the utilization percentage from these two statistics. We decided to have DUMPSTAT do the calculation to keep STAT's load on the server to an absolute minimum. The formula for utilization percentage is: Utilization = 100 - (100 x Number of Polling Loops / Maximum Number of Polling Loops).
The other statistics STAT collects are: Bytes Received (the number of bytes read from the LAN channel, including routed data), Bytes Transmitted (bytes written to the LAN channel, including routed data), Bytes Read (the number bytes read from disk), Bytes Written (the number of bytes written to disk), Packets Routed (the number of packets routed by the server), and Number of Connections (the number of workstations logged in to the server).
To get a copy of STAT and DUMPSTAT, send an email message to novell_research@novell.com with STAT.ZIP in the subject line. We will give further information about STAT in a future AppNote.
* Originally published in Novell AppNotes
Disclaimer
The origin of this information may be internal or external to Novell. While Novell makes all reasonable efforts to verify this information, Novell does not make explicit or implied claims to its validity.