Straight Edge: HOT Tools for Network Troubleshooting
Articles and Tips: article
01 May 2004
This article defines some of the tools which students use in the "White Hat Toolbox" hands-on course that tours around the United States and Europe in 2004. (Visit www.hotlabs.org/whitehat for more information.) Be certain you have permission from the owner of the target system (preferably in writing) before you perform password-integrity tests, port scans, vulnerability scans or any other communication that might be deemed intrusive.
I must admit, my heart skips a beat or two each BrainShare when I look out at the line of eager techies waiting to scan their badges, take their seats and watch the Hot Tools class. This was the third year I'd presented this course at BrainShare and I admit--it is my favorite course to teach! Essentially, we throw out the slide presentation (my apologies to the graphic design team) and we start working live on the network. It is always a blast to start playing on the show network with vulnerability scanners, interceptors and redirectors, packet generators and forensic tools. Live!
Once we took over a security camera and found a guy who had access to a shared directory that really shouldn't have been shared (yipes!). We've found assorted open systems (and I don't mean that in a nice "open source" sort of way) and a few print servers without passwords. If you found those hosts on your network, you would probably shut them down in no time. With the right tools, you can easily find these lapses in your systems and address them.
In addition, with the right tools, you should be able to troubleshoot network communications, locate unsecure systems, identify unsecure applications and trace back to an attacker. These tools should allow you to test systems in your lab, check how an Intrusion Detection System (IDS) handles unacceptable traffic and even note when a user is scanning the network (and hitting your decoy along the way).
Who says networking is boring? C'mon, now! We are in the right field at the right time--all you might be missing are the right tools! Let's examine the low-cost and free tools that make up my White Hat Toolbox.
Ethereal
Of course, every toolkit must include a network analyzer. At BrainShare, I put aside my expensive analyzer solutions with their bells and whistles and I worked almost exclusively with Ethereal throughout the show. As a free protocol analyzer, Ethereal captures traffic, offers solid decodes and some customization. I did begin twitching after a day or so--I missed my charts, graphs and simple filtering system. In an effort to put together a truly inexpensive toolkit, Ethereal would be the analyzer of choice.
You can use a network analyzer to determine if you have unencrypted data crossing your network, troubleshoot network communications and even measure latency on the network.
Although typically pigeon-holed as a troubleshooting tool, your network analyzer can also be used to test the security of an application. During another recent onsite visit, I tapped into a large medical network that had thousands of medical records flowing in clear text to and from numerous connections--frightening when you consider that the United States passed the Health Insurance Portability and Accountability Act (HIPAA) in 1996 which imposes a fine of US$25,000 per incident for each privacy violation. HIPAA is similar to Europe's "Directive on the Protection of Individuals with Regard to the Processing of Personal Data and on the Free Movement of Such Data," which was adopted in 1995.
In Figure 1, I have used Ethereal to capture a plain-text password crossing the wire. You can clearly see SpamKiller (a spam-elimination tool by McAfee Security) sending out the POP password in plain text. I configured the password as "seethecleartextpassword?" in this example because I wanted the password to really stand out in the trace file.
Figure 1: Note the password in this POP login: "seethecleartextpassword"?just to make sure it stands out.
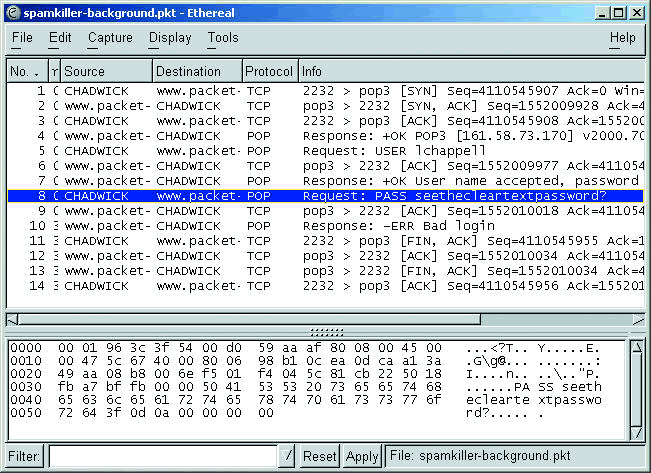
When you run Ethereal to check for plain-text passwords and unencrypted data, make sure you look in the hex window--which is where the clear text information will be visible if it exists.
Other features that make Ethereal stand out are:
TCP trace graphing
Sortable trace files
Live packet capture and display
Custom coloring based on filters
Numerous pre-defined decodes and filter fields
Ability to open numerous trace file formats
I often refer to Ethereal as the "ankle biter" to the big analyzer manufacturers such as Network Associates and WildPackets. If you are used to those full-functioning analyzers, it is difficult to step down to work with Ethereal. If, however, you have not become spoiled by easy charting, graphing and filtering and you are on a severely restricted budget, then Ethereal is the tool for you.
NetScanTools Pro
One of my very favorite tools is NetScanTools Pro--it is a must-own tool for anyone focused on security. From tracing back to an attacker to zipping right through a firewall that blocks ICMP echo requests and replies, this is the tool. This year I demonstrated the newest version of NetScanTools Pro with its slick interface and automated trace-back function.
If you have someone knocking at your network door and you'd like a bit more information about them, click on the Automated button and enter what you know about the target (such as their IP address, domain name or e-mail address). You can choose to be stealthy by not contacting the target directly or go all out and scan the target directly. (Remember the warning about scanning systems without the owner's permission.)
NetScanTools can also be used to locate a rogue server on your network through a simple port scan. In Figure 2, I set up NetScanTools to perform a scan of a set of network addresses (10.1.0.1 through 10.1.0.254) to look for anyone running services on port 21 (typically used for FTP services). There are other tools that can be used for a standard port scan, but NetScanTools offers customized port probes over TCP or UDP. You can create a TCP port probe using any combination of TCP flags--you can even define the source port and Maximum Transmission Unit (MTU) size to checking path MTU.
Figure 2: NetScan Tools Pro provides great flexibility when configuring a port probe.
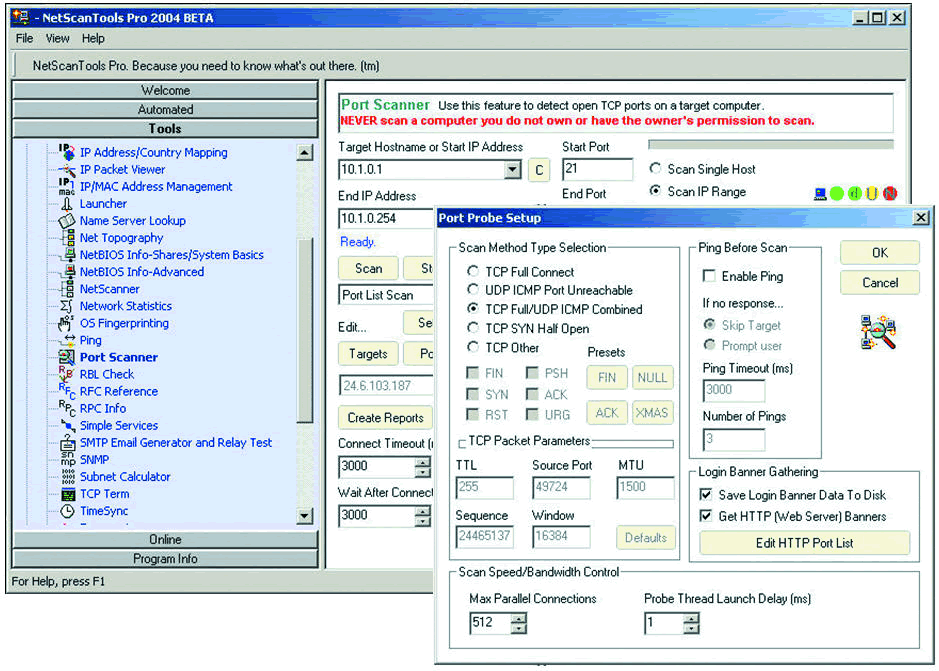
There are so many features available with NetScanTools Pro; you can look for rogue servers by performing a port scan, test blocked ports on a firewall or router, test for SMTP relaying and perform reconnaissance on an attacker. This is why I consider it a "must-have" tool for any network. As an added bonus, Kirk Thomas, the developer of NetScanTools, has also included help files that define the technology as well as the tasks that can be completed with it.
Aida32
My BrainShare demonstration of Aida32 is typically very fast, only because Aida32 can run an audit of my loaded system in just under 15 seconds. Aida32 is a freeware auditing tool that can perform intensely detailed audits of system hardware and software. If you want to know what's on that machine before you send it off for the boss to use at home, this is the tool to use. When the system begins running poorly you can examine the configuration to see if anything has changed; look for those peer-to-peer applications launching on startup and the myriad of games crammed on that drive.
In addition, Aida32 can be used as a forensic tool since it provides a clear report of software loaded on the local system, startup applications, system accounts, software keys and more.
Note: Unfortunately, on March 23, 2004, Tamas Miklos announced that he would no longer be continuing Aida32 development because he accepted an offer to "drive a large development project" and won't have time for the Aida32 private project. Sigh. Fortunately you can still download and use Aida32, there just won't be any additions or future development.
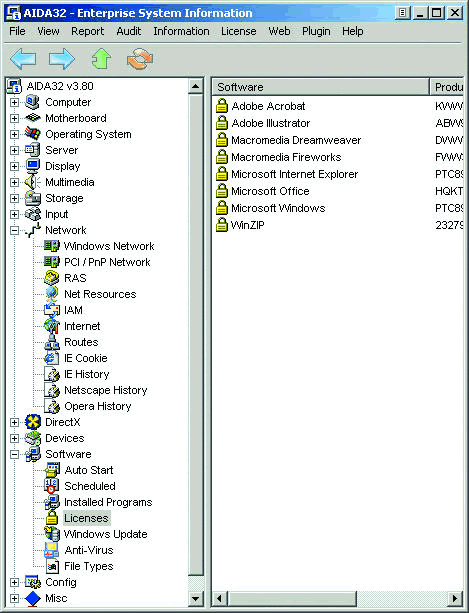
Figure 3 shows the software key listing on a target system. The target can be either a local device or a remote device. By default, Aida32 runs over port 2345 to perform a remote audit of another system, but it can be configured to use another port if desired. Aida32 is one of the jewels that should be in everyone's toolbox.
Figure 3: Aida32 presents a clear listing of licensed software on the target system.
LANguard Network Security Scanner
I learned about LANguard Network Security Scanner (NSS) when I was touring through Australia many years ago. It has remained in the forefront of my toolbox ever since. LANguard NSS is a well-designed and developed vulnerability scanning tool that can help you spot a weakness before someone else does. During one client onsite visit, we found several systems offering FTP services within the network. Users were using this as a back channel to exchange data without authenticating through the network, a clear violation of the company's security policy.
When you run LANguard NSS, be sure to take an Ethereal trace to examine the processes LANguard NSS uses to perform its vulnerability scans. In your trace, you will see LANguard NSS running a NetBIOS name query followed by an SNMP GET request and a series of ICMP packets used to perform an OS fingerprinting operation. What a great trace!
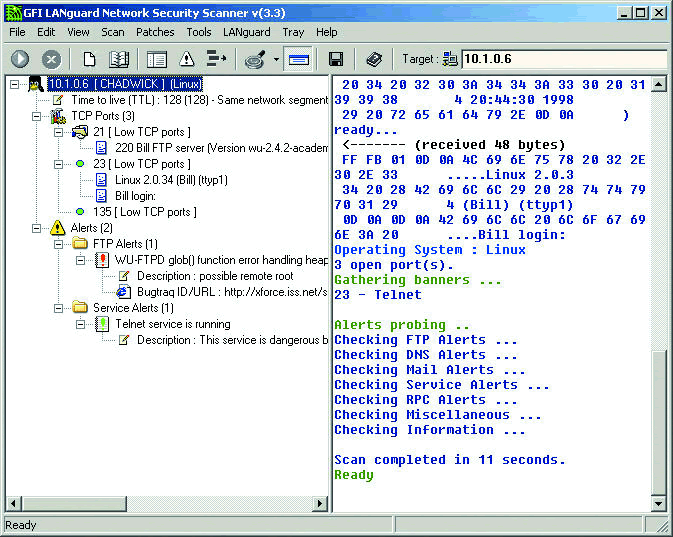
Figure 4 shows the results of a LANguard scan on Chadwick (my primary teaching system, which you may have seen all over the network at BrainShare). LANguard has determined that ports 21, 23 and 135 are open on the target. In addition, LANguard notified me that there are some possible security holes on Chadwick.
Figure 4: LANguard performs a series of queries to identify the operating system, host name, open ports and vulnerabilities. It has a nicely designed interface, solid OS fingerprinting and is easily configurable.
Packet Builder
You can build and transmit packets using network analyzers such as Network Associates' Sniffer and WildPackets' EtherPeek, but they are pretty clumsy at this. They were never designed as packet generators and it shows. Packet Builder is a freeware packet-building utility that was created by Gregory Wilmes of Engage Security.
Note: Packet Builder was previously called Rafale X. You may see some references to the Rafale name at various points in Packet Builder, especially in the scripting area.
With Packet Builder, you can build special packets to identify device vulnerabilities or to perform reconnaissance probes on an attacker. In addition, you can test an IDS or Intrusion Prevention System (IPS) by hand-crafting and transmitting unacceptable packets past the IDS/IPS device. Did it log the packets? Did it try to snipe the connection?
Packet Builder has a nice, clean interface that enables you to build UDP, TCP and ICMP packets in seconds. In addition, you can build the IP header from scratch. Building a packet from scratch requires extensive knowledge of the protocols and fields. Of course you could just build anything you want and see if it makes it through the network to the destination, but keep in mind that you may cause unpredictable behavior or even crash systems that cannot process the bizarre packets you may create. Use some caution here.
Packet Builder allows you to spoof your address. Spoofing your IP address enables you to test your firewall and determine if it allows packets through from restricted addresses. However, Packet Builder doesn't provide any feedback on what is received in response to the packets sent. You must run Ethereal in the background to see your outbound packets and the associated responses, if any.
One of the most impressive features of Packet Builder is its ability to run scripts of entire packet transmission sequences. If you are testing a single machine on a number of vulnerabilities, open up the example *.rsb file that is included with Packet Builder. This file provides you with all the information you need to start building and testing scripted transmissions.
HTTP Sniffer
Did you ever want to see the graphics of someone's HTTP session as it is downloading and displaying on their desktop? HTTP Sniffer is an HTTP graphic reassembler that enables you to clearly see the images that are transferred across the network in HTTP sessions.
There are several reasons why you might want to see the graphics cruising along the cabling system. Consider a user who is hogging the bandwidth of the Internet pipe. Using HTTP Sniffer, not only can you examine the user's HTTP activity, but if you suspect some unusual graphic files (can you spell p-o-r-n?) crossing the wire, you can capture the traffic and view the graphics.
HTTP Sniffer is not a packet-oriented analysis tool. It focuses on the HTTP transactions and files transferred. HTTP requests and replies are grouped together, and the main window displays a total byte count for transferred files, the URL associated with the communications and the HTTP status. The HTTP status column indicates whether a TCP FIN was sent (indicating the transfer was completed) and the response code received from the HTTP server. You can probably imagine how this information can be used for troubleshooting. If a user complains of poor performance when Web browsing, you can rule out HTTP errors by simply viewing the list of response codes in the Status column.
Ettercap
Ettercap is free software (available under the GNU General Public License) that uses ARP poisoning to perform Man-in-the-Middle (M-i-M) -style interceptions of switched traffic. ARP poisoning is performed by sending a series of ARP packets to a target to change the contents of the target's ARP cache. ARP poisoning is typically used to redirect traffic to an intermediary device, such as an Ettercap system.
Now you must be thinking, what? Intercepting switched traffic? Isn't that a hacker trick? Well, it could be. However, it can also be used to troubleshoot network traffic. For example, you may need to find out what data a particular user is sending/receiving on the network. However, your switch is not manageable and doesn't support spanning. Or, you can't put a hub in place to listen in on that user's traffic. You can intercept that user's traffic using Ettercap.
Ettercap uses a three-step process to scan the IP addresses on a network, poison the ARP cache on one side of a local communication and then poison the ARP cache on the other side of a local communication. The switch has no idea that Ettercap has been run; it just forwards packets based on information in its MAC address tables. Ettercap doesn't even alter the switch's MAC address table. Slick, eh?
Naturally, you don't want anyone else running Ettercap on the network. Ettercap has a nice Poison Locater feature that can detect other systems running Ettercap. The Poison Locater sends out a series of ICMP echo request packets with a specific value, 0xe77e, in both the IP header and the ICMP header ID fields. Although many systems may respond to an ICMP echo request packet, they should reply with a different IP header ID field value. If a response contains the value 0xe77e in the IP header ID field, then the sender is most likely running Ettercap.
I recommend you work with Ettercap in your lab. Try all the options available so you know what Ettercap can do for (and to) you.
Brutus Password Cracker
Brutus is a free password-cracking tool that was originally developed in 1998 by Greg Jones as a way to locate routers and other network devices that might be configured to use default or common passwords. At this time, Brutus runs only on the Windows platform (Windows 9x, NT, 2000 and XP). Because Brutus is extremely flexible, you can build customized password-cracking routines.
Brutus is referred to as an authentication engine testing (AET) tool. Password-cracking routines are referred to as authentication tests. Brutus ships with numerous prebuilt authentication tests (such as HTTP-Basic Authentication, HTTP-HTML Form/CGI, POP3, FTP, SMB and Telnet). You can also download other authentication test configurations (such as IMAP, NNTP and NetBUS) from www.hoobie.net and import them into Brutus. This test can really get you in trouble, so be certain you cover yourself before you start running a brute force password crack on the target.
Keep in mind that many systems may be configured to lock an account after a certain number of unsuccessful login attempts. If you run a password-cracking routine on these systems, the attempt will not only be noticed, but may also disrupt accounts. Disrupting accounts can be considered one form of a Denial of Service (DoS) attack in which an attacker purposefully sends invalid user names and passwords in an attempt to lock out an account.
Brutus must understand a protocol or application in order to build a logical process to crack the password. Figure 5 illustrates the process Brutus follows to crack an FTP username/password on a target system. This is a four-step process--two steps to identify the correct user name and two steps to identify the correct password.
Figure 5: Brutus runs through an FTP password crack routine.
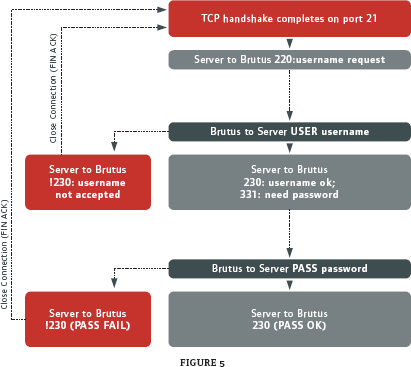
Brutus listens to the FTP response codes sent by the FTP server. During an FTP crack, Brutus understands that response code 220 and 331 are sent by the server to request a user name and password, respectively. A response code 230 always indicates a successful attempt.
Consider downloading a list of default passwords and default user names to test systems placed on the network. No systems should use their default security settings.
Hurricane Search
Hurricane Search is a drive search tool that can be used for forensics or active discovery of specific strings within files on a drive. Formerly called WinGREP, Hurricane Search performs the GREP (derived from Global Regular Expression Point) function of searching through a drive to find lines matching a specific pattern. Hurricane Search can even look inside ZIP files and unencrypted e-mail files for matching strings.
For example, suppose your company recently started negotiating a contract with XYZ corporation to sell widgets to a large customer in Depoe Bay, Oregon. Suddenly a competitor jumps in with a bid that slightly undercuts your company's bid. How did the competitor know your bidding price? Searching for the term XYZ on the salesperson's drive reveals that he has numerous documents he's not supposed to have on his drive.
Or, suppose Fred (the "user from Hell") has been downloading some interesting files, which have eaten up most of your network bandwidth in the past few days. You suspect his drive may contain a ton of music files. Using Hurricane Search, you can search Fred's drive for .mp3. Even if Fred zipped his music files for distribution, Hurricane Search can find them.
I also use Hurricane Search to find specific strings in my trace file directory. Sometimes I configure Ethereal to capture to files directly to my hard drive. I then use Hurricane Search to identify any root.exe or cmd.exe strings in the traffic.
Save your searches as Hurricane Search projects so you can use them again and again. In addition, you can perform these searches on mapped network drives.
Hex Workshop
Hex Workshop is a hex editor developed by BreakPoint Software. Although there are a number of hex editors available on the market, I like Hex Workshop because it has a well-designed interface, accepts large files and includes a simple hex/decimal/ binary converter applet.
Hex Workshop includes a set of hexadecimal development tools for Microsoft Windows. With Hex Workshop, you can edit, cut, copy, paste, insert and delete hex; print customizable hex dumps; and export to RTF or HTML formats. You can also find, replace, compare and calculate checksums and character distributions within a file.
I use Hex Workshop to open suspect applications before launching them. In addition, I use it to edit my trace files before sending them out to vendors or publishing them in courses or articles. (If you take the White Hat Toolbox course, you'll use Hex Workshop to import and export Ethereal filters.)
Keyghost Keylogger
Keylogging is the process of tracking all the keystrokes typed on a keyboard. A hardware keylogger is a physical device that is typically connected to the keyboard and PS2 port to capture all keystrokes typed by a user. A software keylogger is a software program that tracks keystrokes without requiring you to connect a physical device to the target system.
I always travel with my trusty keylogger--last year at BrainShare we had a keylogger set up at our booth for attendees to try. My favorite keylogger is Keyghost. The Keyghost keylogger is made by Keyghost Ltd., in Christchurch, New Zealand.
Two types of Keyghost keyloggers are available: the Keyghost barrel connector and the Keyghost keyboard. The Keyghost barrel connector is a physical device that is connected to the keyboard cable on one end and the CPU's keyboard port on the other end. The Keyghost keyboard is a complete replacement keyboard that contains the keylogging hardware. Everything that is typed on this keyboard is recorded into the Keyghost keyboard's memory.
Warning: Before you even consider placing a keylogger, ensure that you have the authorization to keylog the target. Privacy laws typically prevent you from keylogging someone without his or her permission unless you have implied or explicit authorization from that person to do so. Check your local laws before planting a keylogger on your corporate network.
After you place the Keyghost, every keystroke typed on the system is recorded. With a hardware keylogger, you can catch any changes that are made at the BIOS level (such as setting a BIOS-level password). Software keyloggers cannot detect these changes because software keyloggers must be loaded into memory before they start logging.
After retrieving the Keyghost barrel connector or keyboard, you simply place it on another system, open up a text editor (MS Word or Notepad, for example), and type in the Keyghost password.
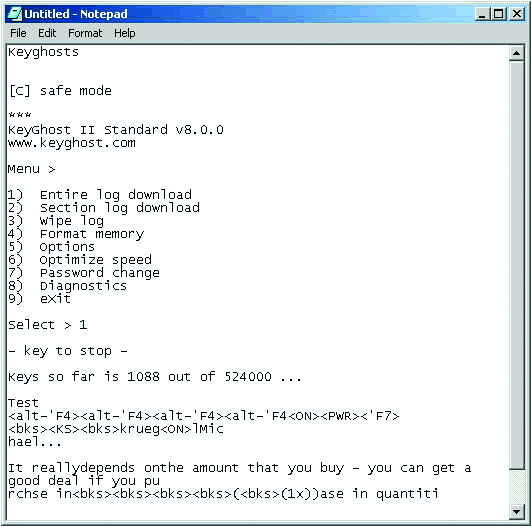
The Keyghost keylogger barrel is shown at the top of this page and the Keyghost menu is shown below in Figure 6.
Figure 6: The Keyghost keylogger barrel connector (above) captures the traffic. Place the keylogger on a second system before typing in the password and the Keyghost menu (below) will appear.
Honeypot: Specter
I showed the Specter honeypot during both the Honeypot session and the Hot Tools session at BrainShare. One of my favorite honeypots, Specter, was developed by Mark Renfer of NetSec in Bern, Switzerland. Although Specter is not free, it is an excellent honeypot and well worth the money (starting at US $599). The interface is clean, the functionality is solid, and it is simple to deploy.
According to pcwebopedia.com, a honeypot is "an Internet-attached server that acts as a decoy, luring in potential hackers in order to study their activities and monitor how they are able to break into a system. Honeypots are designed to mimic systems that an intruder would like to break into but limit the intruder from having access to an entire network."
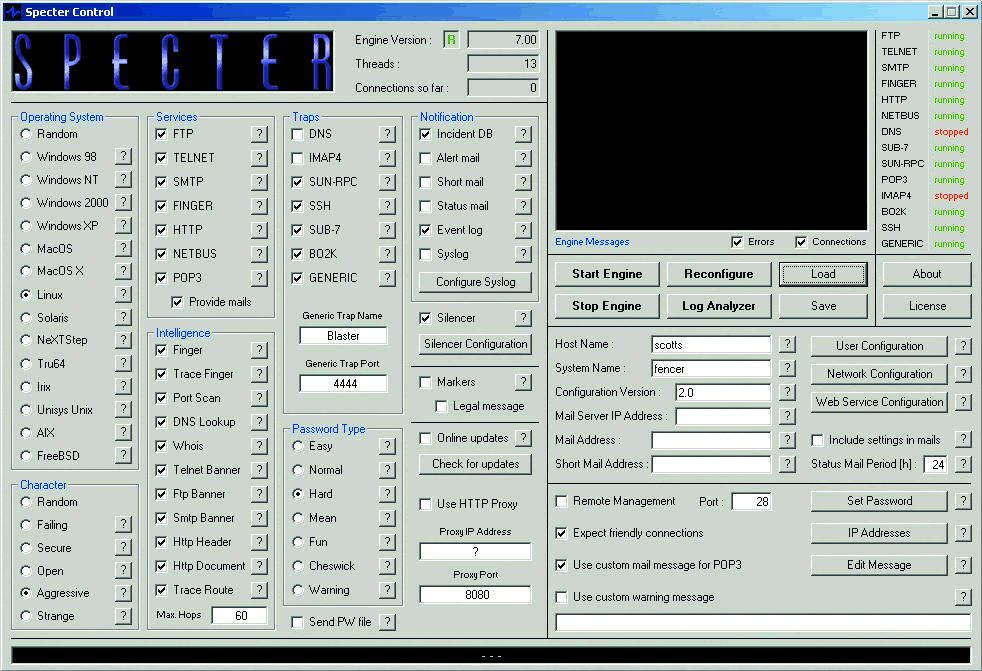
Placing a honeypot in key spots on your network can alert you to scans and some attempted attacks that come from inside or outside the network. Your servers should not be burdened with the task of reporting possible scans--that's the job of your honeypot. A good honeypot doesn't stand out like a sore thumb. It simply looks like a system that has an interesting name, operating system or open port list. Specter has numerous elements that you can configure individually to customize and disguise your honeypot, as shown in Figure 7.
Figure 7: Specter has a well-organized interface, making it simple to configure.
If you are going to configure and deploy a honeypot, consider reviewing the honeypot/honeynet technology and hacker profile information provided by The Honeynet Project. This group boasts of an impressive Board of Directors including George Kurtz, CEO of Foundstone; Bruce Schneier, CTO of Counterpane; Alfred Huger, CTO of SecurityFocus.com; Martin Roesch, CTO of SourceFire; and Jennifer Granick of the Stanford Law School. Check out The Honeynet Project at http://project.honeynet.org.
Our Protocol Analysis honeypot was up and running for much of the time during BrainShare. It was hammered with scans--mostly from people checking out port 79 (the fingered port) since I mentioned that the honeypot would respond to that port although most other systems would not. We could see numerous users trying to bring the honeypot down by performing a SYN attack on several open ports, but the Specter honeypot was configured to allow only 500 connections per service making the attempted Denial of Service attack quite ineffective. We did learn who the aggressive folks were on the show network, however.
This is a perfect example of using a honeypot on the inside of a network to see what your users are up to.
Wrapping It All Up
There are many tools that can supplement the standard protocol analyzers to help you test and troubleshoot your network. Some tools started in the Linux environment and were ported over to Windows. Others were developed directly on the Windows platform. Regardless of which platform you use, consider trolling about on the Internet to locate some of the cool free tools that await you.
And, remember to get appropriate authorization to run these programs on your target(s).
Laura Chappell is a Sr. Protocol Analyst at the Protocol Analysis Institute.
Now What?
Ok, so you've read the article on the Hot Tools and you've downloaded all the free tools and even the demo versions of the "inexpensive, but not free" tools. What should you do first? Here's a list of 10 tasks that you should try out today. (Remember to get appropriate authorization before beginning any task that could be considered intrusive.)
Analyze a Secure Application with Ethereal Launch Ethereal on your own system and set up a capture filter for traffic to and from your hardware address only (for example: ether host 00:d0:59:aa:af:80). Now launch an application that you believe should encrypt its data before sending it across the network. When you view your trace file, pay particular attention to the hex window (bottom window) in Ethereal. Can you recognize any readable text?
Run a Traceback on a Target Launch NetScanTools Pro and select the Automated button to begin a traceback on a target. Ensure you have permission from the target before trying this. First, select Advanced (the most target contact) to learn as much as possible about the target directly from the target. Then enter the information you know about the target such as its IP address or URL. Click on Options to see how the Real Time Blacklist Check (RBL) function is enabled and determine what other processes will run during the traceback. Finally, launch the traceback and examine your results.
Create a Full System Audit Report on Your Machine Launch Aida32 to automatically begin the audit process. Click around the results to examine the information gleaned by Aida32. To build your report, select Report > Report Wizard Pro/Lite. Select All Pages as the Report Profile and choose HTML as the report format. Now be a bit patient as it builds a lovely comprehensive report of your entire system.
Perform a Vulnerability Scan on a Target Launch LANguard NSS and enter a small range of addresses in the target area to begin the auditing process. Now consider performing a LANguard scan on your own system. Enter your actual IP address (not 127.0.0.1) in the target. Examine the results to see how your system would respond to a LANguard NSS vulnerability scan.
Build a Test Packet Launch Packet Builder to begin capturing your own traffic using Ethereal. Remember, Packet Builder doesn't include a packet capture function so you need to run Ethereal in the background. In Packet Builder, click the TCP tab and create a TCP packet. Enter 80 in the destination port field and 1025 in the source port field. Enter the IP address of a target system (you can choose a target that does or does not support port 80). In the TCP section, click the SYN button to make it a TCP handshake packet. Click Send. Examine your Ethereal trace to see the results. Did you receive a TCP RST (indicating the target port is closed) or a TCP SYN ACK (indicating that the target port is open)?
Reassemble Your HTTP Graphics Launch HTTP Sniffer. Click Sniffer > Start to begin capturing HTTP traffic. Now open your Web browser. It doesn't matter what browser you use because HTTP traffic must follow a standard communication pattern. Browse around the Internet a bit to get a nice HTTP trace sample. The graphics downloaded to your system will be listed in the URL column. Doubleclick on an image name listed in the URL column. Click the Content tab to see the image that crossed the wire. Great, eh?
Perform an Ettercap Discovery Process We aren't going to poison anyone's connection here. We're just going to do a bit of ARP-based discovery on the network. Open a DOS box and navigate to the ettercap directory. Type ettercap -h to view your options when running Ettercap. (I recommend you start out with the -d option so your system doesn't try to resolve the names of every host it discovers.) Type ettercap -d and select an interface number if you are offered a choice. Ettercap uses the local host's configuration information to automatically determine what IP addresses should be discovered. When Ettercap is finished, you have a nice list of the systems that could be ARP poisoned and intercepted using Ettercap.
Look for a Specific String in a Trace File Directory You probably have numerous trace files if you downloaded and started working with Ethereal. If not, you can download a number of trace files from www.packet-level.com. Launch Hurricane Search. Enter the string root.exe|cmd.exe in the Search for area. Select your trace file directory in the Directory area. Click Start to begin the search. Hurricane Search will list any files that contain either root.exe or cmd.exe.
Examine an Application Without Executing It-Launch Hex Workshop Select File > Open and select an executable application on your drive. Hex Workshop opens the file displaying the hex values on the left side and the ASCII values on the right side. Scroll through the entire file to look for readable values--in particular, you might find the application's DLL dependencies listed, some commands, error messages and perhaps even a message or two from the program developer.
Set up a Honeypot-Launch Specter Configure your Specter honeypot to match some of the systems on your network by selecting an appropriate operating system, services, host and system name. Be certain to turn on at least one or two interesting services. When you have finished configuring your Specter honeypot, select Start Engine. Let it run for as long as possible. Periodically check the Specter log to see who is knocking on your door!
White Hat Toolbox: Tools of the Trade
|
Name
|
Description
|
Price
|
Website
|
Windows
|
Linux
|
|
Aida32 |
system auditor |
Free |
www.aida32.hu Note: development discontinued on 3/23/04 |
Y |
N |
|
Brutus |
password cracker |
Free |
Y |
N |
|
|
Ethereal |
protocol analyzer |
Free GNU GPL |
Y |
Y |
|
|
Ettercap |
MiM intercepter |
Free GNU GPL |
Y |
Y |
|
|
Hex Workshop |
hexadecimal editor |
US $49.95 |
Y |
N |
|
|
HTTP Sniffer |
graphic reassembler |
US $29.95 |
Y |
N |
|
|
Hurricane Search |
GREP tool |
US $149 |
Y |
N |
|
|
Keyghost |
hardware keylogger |
US $89 and up |
Y |
Y |
|
|
LANguard Network Security Scanner |
vulnerability scanner |
US $315 for up to 25 IPs |
Y |
N |
|
|
NetScanTools Pro |
multifunction tool |
US $199 |
Y |
N |
|
|
Packet Builder |
packet generator |
Free |
Y |
N |
|
|
Specter |
honeypot |
US $599 and up |
Y |
N |
* Originally published in Novell Connection Magazine
Disclaimer
The origin of this information may be internal or external to Novell. While Novell makes all reasonable efforts to verify this information, Novell does not make explicit or implied claims to its validity.