The Network Is Slow: A Protocol-Analysis Case Study
Articles and Tips: article
01 Mar 2002
Editor's Note. This article assumes that you have a basic understanding of protocol analysis. For more information about protocol analysis, see "Basic Packet Filtering Using Your Network Analyzer," Novell Connection, January 2001, pages 40-41. You can also visit http://www.podbooks.com/.
As a protocol analyst, I am, of course, hired to analyze companies' networks. For example, a company may want me to troubleshoot a specific problem, such as slow network performance. A company may also want me to examine overall network performance, optimize network communications and design (correcting problems such as an application running across a WAN link), or look for security flaws or openings (including both physical security and electronic security).
This article recounts an onsite visit during which I was asked to correct a common network problem: slow network performance. This case study explores an actual company's network slowdown, showing how I identified the cause and proposed a solution. To ensure confidentiality, I have omitted the name of the company as well as specific details about the company.
PRIMARY DIRECTIVE
In the context of protocol analysis, the primary directive is the client-defined purpose for my onsite visit. By establishing this primary directive before I begin to troubleshoot the network, both the client and I establish the expectations for my visit. The client in this case study sent the following description of the network problem:
"Our network has been in a constant state of change for the past four months. After we experienced some server abends on a single NetWare server approximately two months ago, we upgraded our cabling system. When the server was restarted, everything was fine for about two weeks. Then, suddenly we began to experience severe slowness on the network--slow logins, slow application launches, and generally lousy performance. Help."
TOOLS
The list of recent network changes at this company is overwhelming. The following details describe the events that preceded the network slowdown:
The primary server abended twice. The first time the server abended, the fault pointed to the TSA NetWare Loadable Module (NLM). The second time the server abended, the fault pointed to the Sitemeter NLM running on the server. The server was restarted without the Sitemeter NLM and did not abend again.
The company replaced a failed switch.
The company updated some cabling.
The company was performing initial tests on NetWare 5 on a lab server that was separate from the production network. This lab server was running TCP/IP.
User complaints indicated that the entire company was experiencing slowness. Only IPX-based communications appeared to be affected.
The operating system vendor verified that the servers were now working fine. The router manufacturer verified that the routing devices were performing properly.
In fact, the company's servers and workstations were not displaying any error messages to indicate the cause of the network slowdown. I could solve this problem only by using a protocol analyzer. In this case, I used Sniffer from Network Associates Technology Inc. (http://www.nai.com/) and EtherPeek from WildPackets Inc. (http://www.wildpackets.com/).
Before I began troubleshooting the network, I determined that this situation had some bad news and some good news: The bad news was that this network was constantly slow. The good news was that this network was constantly slow. Because the slowdown was constant, I could certainly capture a trace of slow communications during my short tenure onsite.
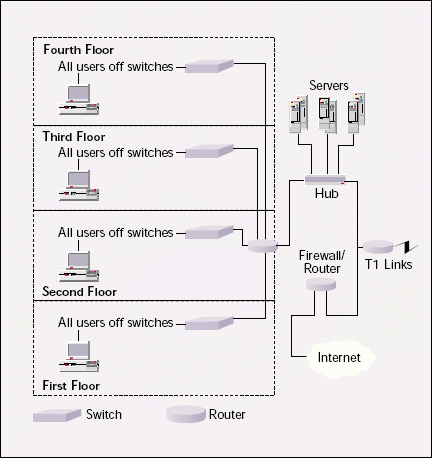
Figure 1 shows the basic design of the company's network, including seven Windows NT servers and 12 NetWare servers on the back end. Approximately 300 local users and 1,200 remote users connect to the network. The remote users connect via T1 links from several branch offices in the same state.
Figure 1
THE BASICS
To determine what is causing the network to slow down, I want to look at a number of things, including the following:
General Traffic. Does anything stick out as strange?
Broadcasts. Do periodic broadcast storms occur? Are there any router reconfigurations that may cause sudden outages on the network? (These router reconfigurations may be indicated by the Internet or by a T1 router.)
Multicasts. Does the network have a multicast storm problem? Does the network have multicast-based route reconfigurations?
ICMP Packets. Do any Internet Control Message Protocol (ICMP) packets indicate misconfigurations, loops, or services that are available sporadically?
Protocol Distribution. Is anything unexpected happening with the network protocols?
Client Boot-Up Sequences. What happens when the client simply boots up? Do any severe slowdowns occur during the boot-up sequence?
Client Login Sequences. What happens during the login process? Can I identify any slowdowns during the login sequence? How does the client get configured during this process? Do any errors occur?
Network File Transfer Times. How much time does it take to copy a big file (at least 40 MB) across the network?
Internet Access Times. What is the roundtrip time when users access the Internet? Although the company says that the slowdown is only IPX-related, I will examine the IP traffic as well, especially since the company is migrating to an "all TCP/IP" network soon.
Note. At this point, I find myself moving away from the Primary Directive. I have a nagging feeling that I should spend some time ensuring the company's TCP/IP network is healthy. After all, TCP/IP is their future. However, I realize that I need to focus on the Primary Directive first. I'll look at TCP/IP last.
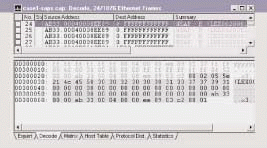
Looking at the general traffic reveals some excessive broadcasts from several users whose workstations are set to use autoframe type negotiations. Blah! Autoframe type negotiations have no use on today's networks. They are a throwback to the days when we did not know what frame type IPX was using at the NetWare server.
Spotting an autoframe type negotiation is easy. You look for a series of identical summary entries clustered together. I can tell these frames are part of the autoframe type detection process because the destination network address starts with 0 (a zero-network). (See Figure 2.)
Figure 2
To determine if autoframe type negotiations are occurring on your company's network, you can build a zero-network filter, which will capture all traffic sent to or from IPX network 0 (zero). (For more information about building address filters, see "Basic Packet Filtering Using Your Network Analyzer," Novell Connection, Jan. 2001, pp. 40-41. You can also read Packet Filtering: Capturing the Cool Packets! a book that is available at http://www.podbooks.com/.)
If a device has not initialized a frame type, it uses this zero network number. If your network is plagued with zero network packets, you need to streamline and define frame types on the network.
To solve this problem, you configure each client to use a single frame type (for example, Ethernet 802.2). Then, you can capture the IPX Router Information Protocol (RIP) traffic to determine if any client is still using autoframe type negotiations.
WINS SUCKS
The network I am analyzing also has a plethora of Windows Internet Naming Service (WINS) broadcasts. Although these WINS broadcasts are not causing a particularly devastating amount of broadcasts, they are ugly. If you do not have a WINS server on your company's network, get rid of the WINS broadcasts.
When a protocol analyzer's "expert system" alerts me that the network has too many unanswered WINS broadcasts, I look at this as a good thing. I think WINS sucks. I can't wait until the day when we can move to a more mature and functional name discovery system instead of WINS. If your company's network includes a bunch of Microsoft operating systems, you undoubtedly have a bunch of WINS broadcasts flowing about the network.
The workstations on this network transmit a series of WINS broadcasts that alone add 46 seconds to the login process. Throughout the day, these broadcasts can add sporadic delays as the WINS lookup process executes.
Figure 3 illustrates the WINS communications. The client (10.2.1.242) transmits a WINS subnet broadcast to 10.2.1.255. The receiving host, 10.2.4.142, responds with an ICMP Destination Unreachable: Port Unreachable message, indicating that the receiving host does not support NetBIOS NameServices on port 137. Any WINS traffic that is answered with an ICMP Port Unreachable message is unnecessary overhead.
Figure 3
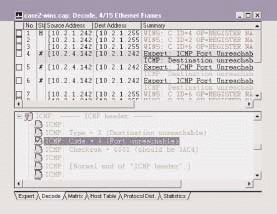
The likely cause of this congestion is a router that is configured with a helper function to forward WINS broadcasts to a specific device--in this case, 10.2.4.142. This host, however, does not support WINS. You can confirm this situation by viewing the WINS traffic on the other side of the network router to see how this traffic is being forwarded.
As always, you want to limit broadcasts on the network because they impact all devices within listening range. In the case of WINS name resolution processes, the sending host experiences process delays while it waits for confirmation or responses to its WINS broadcasts.
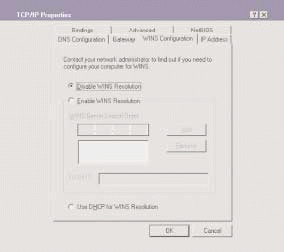
Before you can dump the WINS configuration at the client, however, you must determine if your company's network has any WINS dependencies. You must track the traffic to and from the WINS server to see which devices are communicating with the server successfully. After you confirm that the network does not depend on WINS, you can reconfigure the client by selecting Disable WINS Resolution in the WINSConfiguration tab of the TCP/IP properties window. (See Figure 4.)
Figure 4
After you have removed WINS from all clients (if possible), you should build a WINS filter to determine if any WINS traffic still exists on the network. The WINS filter should be based on all traffic to or from port 137--the NetBIOS Name Service port.
Figure 5 shows the basic settings for a WINS pattern filter. WINS traffic can be filtered on the decimal value 137 (hex0089) in either the source or destination port field. In Figure 4, I have built a filter that filters on the source port field. The destination port field is offset 24.
Figure 5

WHAT IN THE WIDE, WIDE WORLD OF SPORTS . . . ?
The client start up sequence is where the real meat of the "slow network" problem surfaced. This particular case study is an interesting one. First, let me explain the steps that I usually take to catch network slowness.
First, I look at the typical latency time between a client and a server to see if packets have a problem getting from one place to another on the network. If the roundtrip LAN times are just a few microseconds or milliseconds or if I see a slowness with every request and reply set and any retransmissions or timeouts, then I look at the infrastructure as a possible problem.
If most request and reply sets are quick, however, I look for anomalies--sudden moments when the response time climbs outrageously. To do this, I scroll through the summary of the boot-up and login sequence, looking at the delta time column to see if I can identify any sudden increases in the response times. Sounds simple? It is. In fact, more than once I've had someone over my shoulder ask, "Are you really going to scroll through all two thousand packets?" My answer is always "Yes."
Figure 6 shows part of the boot-up sequence. The delta time column on the right side shows the time between packets in (seconds.milliseconds.microseconds).
Figure 6
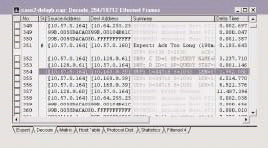
As I peruse the delta time column, I see the delta time suddenly jump to 3.2 seconds as the client launches a Domain Naming System (DNS) query. Then I see a rather quick DNS response (packet 353). Launching the DNS query was a bit sluggish, but the client did receive an answer.
Next, I see a strange sequence of packets that receive no answer (packets 354, 355, and 356). The delta time field indicates a 6-second delay after each of these User Datagram Protocol (UDP) transmissions. What are these transmissions all about? I hate seeing unidentified traffic on the analyzer.
If you capture such unidentified traffic, you can look at the port number to see if the traffic can be identified. The Internet Assigned Numbers Authority, or IANA (http://www.iana.org/), maintains a list of port numbers and the services assigned to those port numbers. In this case, IANA states that port number 34716 is not assigned. The port 1036 is used as the dynamic client port for these communications.
Before I start making any type of assumptions, I need to determine if this sudden sluggishness occurs at another point in the boot-up sequence. To do so, I build a filter for all UDP traffic to port 34716, as shown in Figure 7. (Keep in mind that this filter is built on the packet offset instead of the protocol offset. If you try applying this filter to a Token Ring network, it won't work.)
Figure 7

When I apply this filter, I suddenly see a pattern in the boot-up/login sequence. (See Figure 8.) I've already seen packets 354-356 and noted the delay that occurs at that time. Now I look at the next set in this process--packets 3210-3212. (See Figure 9.)
Figure 8
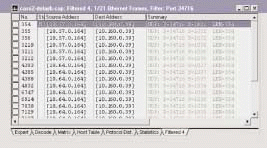
Figure 9
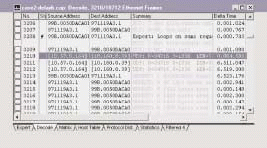
I find some ugly patterns here. I see the same process occurring again--another 6.5 second delay between each packet in the set. This process seems to indicate an application is locking up the client while it waits for another device (10.160.0.39) to answer. What is this application, and why isn't device 10.160.0.39 answering?
A simple ping identifies the problem--no device is using IP address 10.160.0.39. I now have to figure out why the client is trying to talk to a nonexistent device.
By looking at the IP address discovery process--the DNS query--I can see that the client is looking for a server called BBBI-1 in the domain BBBINY-i.com. Interestingly, that is the name of the company's IPX-based file server. This discovery prompts two questions:
The server does not support TCP/IP yet. Why is the client sending out DNS queries looking for the server's IP address?
Why is the address 10.160.0.39 returned to the client if that server does not support IP?
The company's IS staff immediately recognized the number 10.160.0.39 as one of the sample IP addresses they placed in the DNS server tables in preparation for the migration to run NetWare over the TCP/IP. The entry was bogus.
Next, I looked at the client to figure out why it is looking for that service. If you examine the client's boot-up sequence, you can see numerous unanswered Service Access Protocol (SAP) queries. These queries typically occur a few packets before the DNS query process or the strange unanswered UDP communications.
These SAP queries are for the Sitemeter service--the service that was listed in one of the server abends. The Sitemeter NLM service is no longer running on the server.
What happened here? In my opinion, this is what transpired: The Sitemeter client found the DNS entries that had been implemented to prepare for NetWare 5. That DNS response made the Sitemeter client believe Sitemeter services were available over the TCP/IP stack.
Each time the Sitemeter client process needed to locate the Sitemeter service (which appeared to be at random intervals), the client issued a SAP query (which went unanswered). The client then issued a DNS query. Most likely, the client used the server name because the NLM probably used the server's name. That DNS query was answered with the fake IP addresses put in place for NetWare TCP/IP migration.
The client then attempted to talk to the Sitemeter server over UDP/IP, locking up the workstation for 6-20 second intervals throughout the day. You can see the 20-second delay in that first trace of the client boot-up sequence. (See Figure 6.) As I capture file transfer processes and other workstation boot sequences, I also notice that the problem is common among all clients on the network.
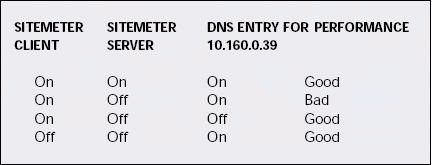
For example, when a user launches Word to edit a document, the Sitemeter client begins the lookup process, and the UDP delay problem occurs. When I remove the DNS entry, the Sitemeter client can resolve the lack of services quickly, thus causing minimal delay. Figure 10 illustrates the different communications sequences of interest in this situation. You can identify bad performance when you see a combination of the Sitemeter server NLM being unloaded and the DNS entry information being incorrectly set.
FINALLY, A SOLUTION
During this onsite visit, the IS staff deleted the DNS entries to enable the Sitemeter client to resolve the lack of services quickly. This solution does not eliminate the entire problem, however. When the client migrates to NetWare 5, those DNS entries will need to be activated again. Although further testing will be needed at that time, I imagine the DNS query will be successful. The client will send the UDP packet to a valid address, and then the server will send an ICMP port unreachable response. That response should enable the client to move forward and recover.
Laura Chappell performs onsite network analysis sessions for troubleshooting, optimization, and security checks. She also teaches hands-on courses on protocol analysis. Be sure to catch her presentations at BrainShare 2002 Salt Lake City.
To learn more about packet filtering using Network Associates' Sniffer or Wild Packets Inc. EtherPeek, you can read Packet Filtering: Catching the Cool Packets! Chappell's new book, which is available at http://www.podbooks.com/.
* Originally published in Novell Connection Magazine
Disclaimer
The origin of this information may be internal or external to Novell. While Novell makes all reasonable efforts to verify this information, Novell does not make explicit or implied claims to its validity.