Using the Sniffer Capture Window or Panel: Capture and Understand Network Traffic
Articles and Tips: article
01 Nov 2000
Editor's Note: This article is directed to network administrators who have just started to use Network Associates' Sniffer Basic Network Analyzer to troubleshoot their company's network.
Network analyzers tap into networks and make copies of the network traffic for analysis and troubleshooting. This article focuses on the capture gauge of Network Associates' Sniffer Basic Network Analyzer. However, other analyzers, such as LANalyzer and Wildpackets' (formerly AG Group) Etherpeek/Tokenpeek products, also offer capture gauges. This gauge enables you to track the status of the capture buffer (the storage area for those copied packets) and observe some basic statistics about the traffic captured by the buffer.
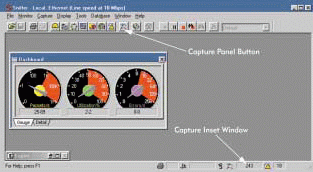
When you start capturing data with Network Associates' Sniffer Basic Network Analyzer, the Capture Gauge window will not open automatically. In order to find out how many packets you have captured, you can look at the Capture Inset window at the bottom right-hand corner of the screen. (See Figure 1.)
Figure 1: When you start capturing data on your company?s network, you can see how many packets you?ve captured in the Capture Inset window. You can then click the Capture Panel button to get more information.
If you want more information about the status of the capture buffer, click the Capture Panel button, as shown in Figure 1. The Capture Gauge window then appears, displaying the following two dials (See Figure 2.):
Figure 2: The Capture Gauge window displays the packets dial and the buffer percentage dial.
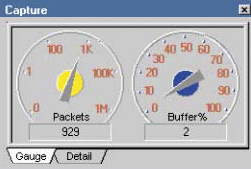
The packets dial
The buffer percentage dial
DIALING FOR PACKETS
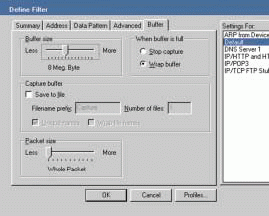
The packets dial shows how many packets have been captured into the trace buffer. Although the dial shows up to one million packets, the actual number of packets you can capture will depend on the size of the trace buffer. To configure the size of the trace buffer, you select the capture filter and click the buffer tab. (See Figure 3.)
Figure 3: The capture buffer configuration window enables you to configure size and other characteristics of your buffer.
The buffer percentage dial shows how full the trace buffer is. When the trace buffer is 100 percent full, the Sniffer will either stop capturing packets or wrap the buffer. ("Wrapping the buffer" means that Sniffer will begin overwriting the first packets that were captured in the buffer.) You can configure Sniffer to either stop capturing packets or to wrap the buffer. (See Figure 4.)
Figure 4: The Capture Detail window displays information about the current buffer you are using.
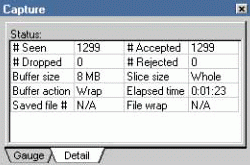
DETAILS, DETAILS, DETAILS
If you look at the bottom of the Capture Gauge window shown in Figure 2, you will see the Detail tab. When you click the Detail tab, the Capture Detail window appears, displaying additional information about the status of the trace buffer. (See Figure 4.) For example, you can view current settings such as the following:
Buffer Size
Buffer Action
You can also view the following fields:
Saved File #. You can designate whether or not you want to save the packets you capture to a file. You may want to save packets to a file if you are not going to be viewing the analyzer when the capture occurs and if you don't know how much data you must buffer. For example, if you set up your analyzer to start capturing all FTP traffic from a suspect station between the hours of 1:00 a.m. and 3:00 a.m., you can set up the analyzer to capture all of the traffic to a series of files. When you configure your analyzer to capture packets to a file, you can also specify the filename prefix (such as "FTP-") and the maximum number of files to save. In addition, the size of the file is often configurable. (If you plan to move these files using floppy disks, you should consider capturing 1.4 MB files.)
# Seen. This field shows the total number of packets that the Sniffer has seen, regardless of whether or not the Sniffer has buffered the packets.
# Accepted. This field indicates the number of frames that the Sniffer buffered. These frames meet the filter criteria. View this indicator when you have defined a filter and you want to know how many packets meet the filter as opposed to the total number of packets seen.
# Dropped. This field shows if Sniffer has dropped any packets. You may find that Sniffer drops packets when the network becomes extremely busy and Sniffer can't keep up with the traffic.
# Rejected. This field indicates if Sniffer has rejected any packets because they did not meet the filter specified. This information is useful to compare the filtered packet count with the unfiltered packets that you are not capturing.
Slice Size. This field indicates whether Sniffer is capturing entire packets or just a portion of the packets. For example, if you want to capture a large number of packets but the buffer fills too quickly, you can choose to capture only the first 32 bytes of each packet. By capturing the first 32 bytes, you can look at the Ethernet header (14 bytes for an Ethernet II header) and a portion of the IP header (typically 20 bytes long) of each packet. You can use these headers to determine who is sending data to whom and the path that data travels on the local network.
Elapsed Time. This field shows the amount of time that Sniffer has been capturing packets.
File Wrap. This field indicates whether packets saved to a file have been overwritten (if you have enabled the Save to Files option).
CONCLUSION
You may want to spend some time playing with the capture buffer settings. However, be careful: If you play with the Saved File # option, you better have plenty of disk space! It is easy to fill up a hard drive with packets from your company's network.
The senior protocol analyst at the Protocol Analysis Institute, Laura Chappell also writes self-paced troubleshooting courses ( www.podbooks.com ) . To view Chappell's analysis information, visit www.packet-level.com . Do you have a great idea for an article, documentation, or training? Send an e-mail message to Laura at lchappell@packet-level.com.
* Originally published in Novell Connection Magazine
Disclaimer
The origin of this information may be internal or external to Novell. While Novell makes all reasonable efforts to verify this information, Novell does not make explicit or implied claims to its validity.