NDS iMonitor: eDirectory's Management Utility
Articles and Tips: article
Senior Research Engineer
Novell AppNotes
kburnett@novell.com
01 Jan 2003
Welcome to the new year of 2003! Since this is the January issue of AppNotes, I thought I would start on a new topic and cover NDS iMonitor. First I'll give a feature overview. This will be followed by several columns on how to use NDS iMonitor to solve eDirectory problems.
At the outset, I want to give some credit where credit is due. There are some very brilliant minds behind the creation of eDirectory and NDS iMonitor. But since these brilliant minds do not particularly want their names spread across these pages, I will state for the record that I obtained some essential help for this column from these people; however, they wish to remain anonymous. You can see them at BrainShare 2003 if you attend any of the numerous eDirectory classes that are available.
NDS iMonitor provides efficient, "anytime-anyplace" monitoring and diagnostic capability to all servers in your eDirectory tree. NDS iMonitor is a highly specialized eDirectory HTML emitter. However, it does not require a Web server to run. It also will monitor your entire eDirectory tree from a common workstation (see Figure 1).
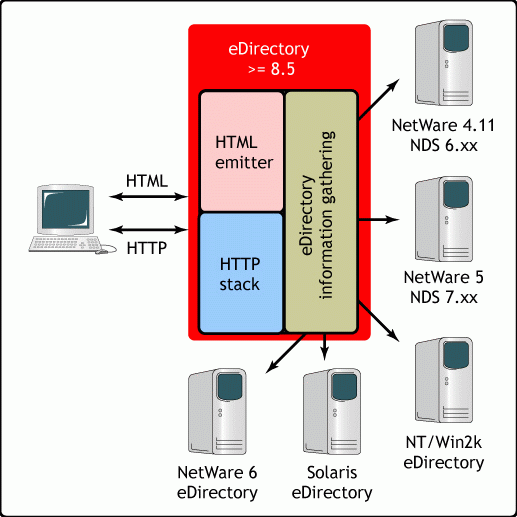
NDS iMonitor architecture
Bringing up NDS iMonitor is quite straightforward. Make sure the client you use has a Web Browser installed on it. (Internet Explorer 5.5 or greater and NetScape Navigator 4.7 or greater are recommended.) Type the following URL: http://<your server name or IP address>/nds . If you are running a Web server or multiple Web servers, you may need to add the port number: http://your server name or IP address> :8009/nds . Figure 2 shows the opening screen.
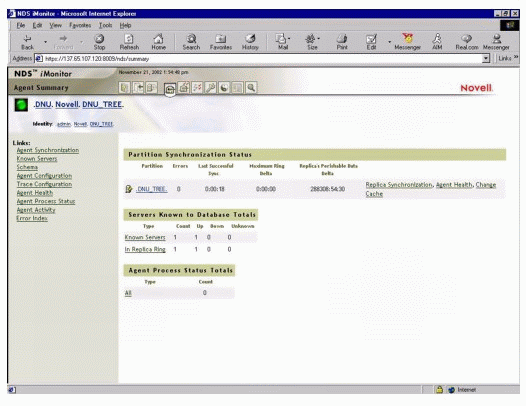
NDS iMonitor opening screen
Another cool thing about iMonitor is that the NDS information gathering functionality of NDS iMonitor allows the querying of data from NetWare 4.11 servers through NetWare 6 running NDS 6.xx through the current version of eDirectory. Also, eDirectory on Windows NT/2000 servers and Solaris servers is supported.
NDS iMonitor Features
NDS iMonitor has had several releases in the past year. Starting out at version 1.0, then 1.5, it is now at version 2.0.
Features that were available in the 1.0 version (and are available in the current version) include the following.
Agent Health Summary includes NDS synchronization information, known servers, and the current processing state of each agent.
Hyperlinked NDS Trace includes all of the features you have come to expect from NDS Trace on NetWare plus links to help you in your debugging efforts.
Agent Configuration allows you to configure the Agent triggers, Agent synchronization, and Database cache (see Figure 3).
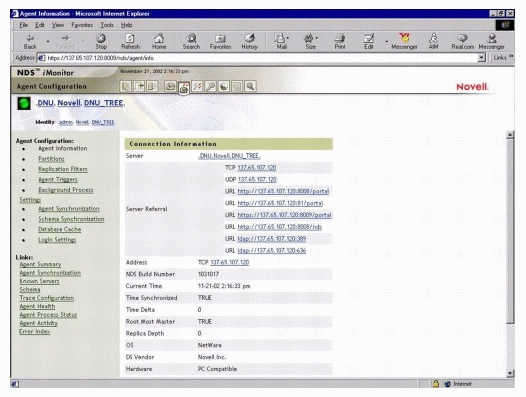
Agent Configuration Menu
Partition List allows you to see everything you ever wanted to know about your eDirectory partitions.
Objects/schema browser allows you to look at objects and their associated attributes, as well as schema properties.
Agent Information including Agent health and process status.
NDS Repair is used to fix common problems with eDirectory.
Agent Activity and verb statistics shows Agent activity states and current statistics.
Error information is a comprehensive database of all of your favorite eDirectory errors and a lot more. Click on the error number to get an expanded explanation.
NDS iMonitor v1.5 Features
NDS iMonitor v1.5 adds quite a few features for those of you who like to see what is really happening under the hood of NDS. Included are the following:
Interface. The interface has been changed to increase the usability and interaction with iMonitor. A lot of these changes have come from surveys and interactions at BrainShare and other public meetings.
Agent Health Checks. Makes sure that the agents on every server is running and is error free.
DirXML monitor. Monitors the behavior of your DirXML driver(s). Helps with debugging a DirXML driver too!
Search. Searches your directory tree for objects and attributes.
Reports. Allows you to create reports about Obituary information, Agent information, or custom reports.
NDS Repair has been enhanced.
Agent Configuration has been updated to include Replication filters.
Object browsing has been enhanced to show Entry synchronization.
Schema synchronization has been enhanced to show the Schema synchronization list.
NDS iMonitor v2.0 Features
NDS iMonitor v2.0 adds a host of new features including:
Interface changes as a response to public opinion. (This will be an ongoing effort for the life of the product.)
Shared HTTP stack
Reports updated (see Figure 4)
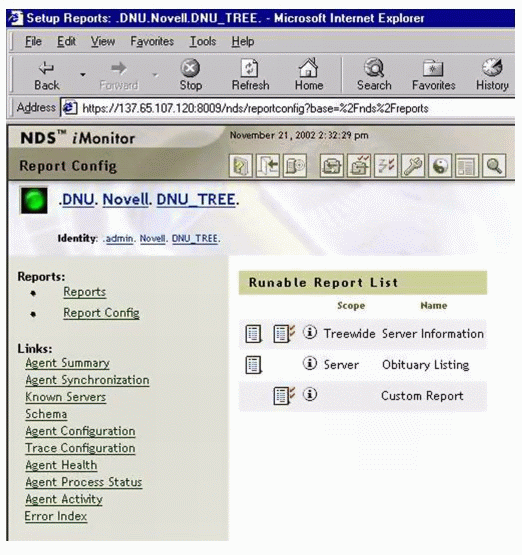
Report Configuration
Object statistics
Advertising
Tree-wide health checks
Connection monitor
Inbound connections
Outbound connections
Identities
Contexts
Iterations
Bad addresses
Event Monitor
Event statistics
Event registration
Event rights
Event trace
In addition, NDS Trace has been expanded to be better than ever (see Figure 5). There is also a full system- level browse to check on your directory from a top-view.
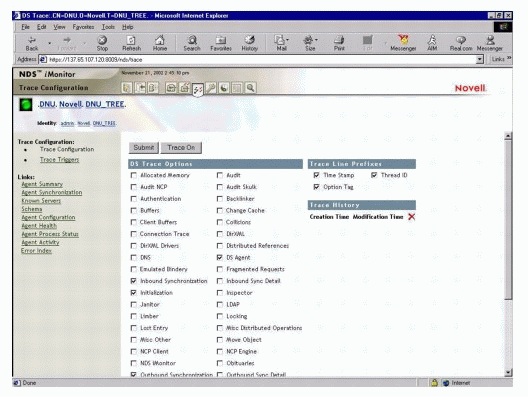
NDS Trace is intergratied into NDS iManager
Anatomy of an NDS iMonitor Page
The NDS iMonitor page can be subdivided into four sections or frames: Navigator frame, Assistant frame, Replica frame and Data frame (see Figure 6).
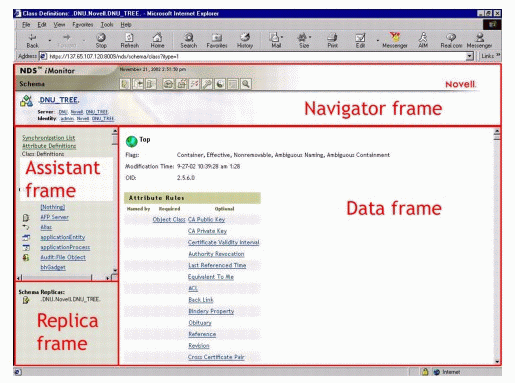
Anatomy of an NDS iMonitor Page
The Navigator frame shows you information such as the server you are looking at, your context, and the tree you are attached to. It also allows you to change this information. What you see depends on three factors:
The identity you have established. This is shown in the Navigator frame. Your identity's eDirectory rights are applied to every request made. Also, login functionality allows you to establish a non-public identity.
The eDirectory agent version you are monitoring. This can be influenced by new features, enhancements, bug fixes, etc.
The NDS iMonitor version you are accessing.
The Assistant frame has links to other useful information that can help you in your investigation. For example, if you are looking at the NDS Schema, it will give you links to class definitions.
The Replica frame is not visible in all options, but when it is visible, the frame provides a listing of the replicas in your directory tree.
The Data frame is the biggest frame and contains just that--data. Depending on the option you have selected in the Assistant frame or the buttons in the Navigator frame, the Data frame will contain pertinent information relating to the information selection.
Two Modes of NDS iMonitor
NDS iMonitor sports two different modes of operation: Direct mode and Proxy mode. No configuration changes are necessary to move between these modes. NDS iMonitor will move between these modes automatically, but an understanding of them is a plus to successfully navigate the eDirectory tree.
iMonitor uses Direct mode when your Web browser is pointed directly at an address or the DNS name on a machine running iMonitor and is reading only information from that machine's local eDirectory database (DIB).
Some iMonitor features are server-centric; that is, they are only available to the iMonitor running on that machine. These features use local API sets that cannot be accessed remotely. Server-centric features in iMonitor include DS Trace, DS Repair, and Background Process Schedule pages. When using Direct mode, all iMonitor features will be available on that machine.
Key features of Direct mode include:
Full server-centric feature set
Reduced network bandwidth (faster access)
Access by proxy still available for all versions of NDS
iMonitor uses Proxy mode when your Web browser is pointed at one machine that is running iMonitor, but is gathering information from another machine. Because iMonitor uses traditional eDirectory protocols for nonserver-centric features, all previous versions of NDS back to NDS 6.x can be monitored and diagnosed. However, server-centric features use APIs that cannot be accessed remotely.
While in Proxy mode, if you wish to switch to Direct mode for a different server, you can do so as long as it is running a version of NDS which supports iMonitor. If the server you are gathering information on by proxy has iMonitor running, you will see an additional icon button in the Navigator frame. When you mouse over the icon, you will see a link to the remote iMonitor on the remote server.
If the server you are gathering information on by proxy has an earlier version of NDS, you will not see an additional icon and you will always have to gather information from that server by proxy until it is upgraded to a version of NDS that includes iMonitor.
Key features of Proxy mode include:
Not every server in the Directory tree must be running NDS iMonitor in order to use most iMonitor features.
Only one server is required to be upgraded.
There is a single point of access for dial-in.
You can access iMonitor over a slower speed link while iMonitor accesses NDS information over higher speed links.
Previous NDS version information is accessible.
Server-centric features are only available where iMonitor is installed.
Some iMonitor Screens
For the remainder of this article, let's look at a few NDS iMonitor screens to see some of the things that you can do.
The Agent Summary screen can be used to determine the health of your NDS agents that are running on each of the servers in your directory tree. Clicking the Agent health link in the Partition Synchronization Status table brings up the Agent Health screen.
The Agent Health screen (see Figure 7) allows you to quickly check the status of your directory tree, server by server, with easy to distinguish green, yellow and red indicators. If all is well, all indicators will be green. Yellow indicates a warning and red indicates a definite problem. Some of the items monitored include partitions and replica rings.
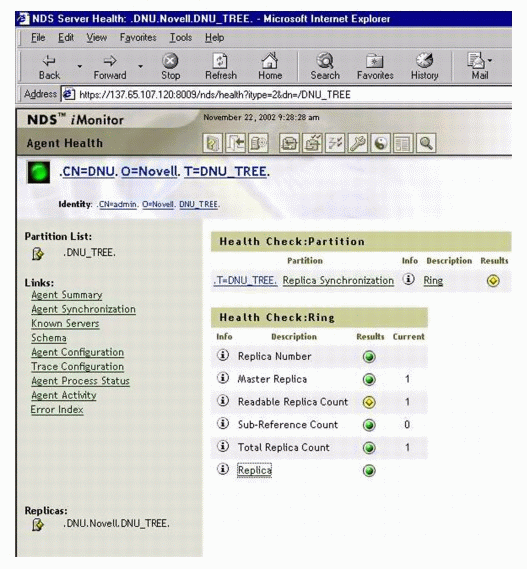
Agnet Health Screen
Under Health Check: Ring, clicking on the Replica link will display a much more detailed screen concerning the health of your replica(s).
The Extended Replica information screen is helpful in troubleshooting replica specific problems. The left-most pane displays the replicas in your directory tree. The right-most pane displays information about the chosen replica (see Figure 8). This information is summarized in the table below:
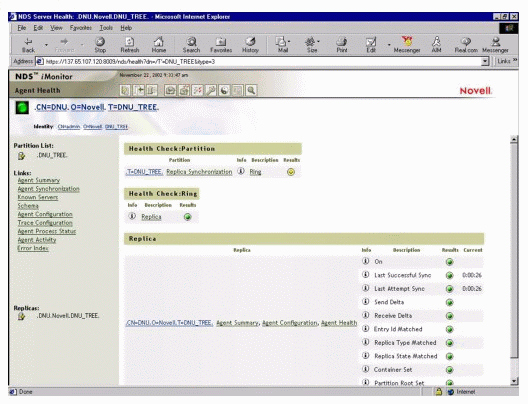
Extended Replica Information Screen
|
State
|
Description
|
|
ON |
If the replica state isn't On, then a partitioning operation is in process. Other replica states include New, Change Type, Locked, Join/Split, Dying, etc. If the state hasn't changed within 4 hours, a suspect is displayed. After 24 hours, a warning is displayed. |
|
Last Successful Sync |
Lists the date and time that the replica was successfully able to synchronize on this server. |
|
Last Attempt Sync |
Reports when the server last attempted communication with other servers. A general rule of thumb is that under normal circumstances, the server should attempt communication at least every 30 minutes. |
|
Send Delta |
Lists the amount of data that has yet to be replicated to other servers. |
|
Receive Delta |
Lists the amount of data waiting to be received from another server. |
|
Entry ID Matched |
Reports whether the physical replica ID matches the logical replica ID. (Mismatches should be resolved with the help of Novell support.) |
|
Replica Type Matched |
Reports whether the physical replica type matches the logical replica type. (Mismatches should be resolved with the help of Novell support.) |
|
Replica State Matched |
Reports whether the physical replica state matches the logical replica state |
|
Container Set |
Reports whether the partition is designated as a container. |
|
Partition Root Set |
Reports whether the physical and logical records both show that the server holds a partition. A mismatch between the physical and logical records might be caused by duplicate server or tree names or by two different servers using the same address. (Mismatches should be resolved with the help of Novell support.) |
Next month, we'll continue our overview of the NDS iMonitor utility.
* Originally published in Novell AppNotes
Disclaimer
The origin of this information may be internal or external to Novell. While Novell makes all reasonable efforts to verify this information, Novell does not make explicit or implied claims to its validity.