Using ZENworks for Servers 3 Server Management
Articles and Tips: article
Software Engineer
Novell, Inc.
bwdayley@novell.com
Ron Tanner
ZENworks Product Manager
Novell, Inc.
rtanner@novell.com
Thanks to DaNae Dayley for her assistance in preparing this material.
02 Jun 2003
One of the most difficult tasks enterprise network administrators must face is how to manage the numerous servers on their network. This AppNote discusses the powerful tools and services included with ZENworks for Servers 3 that help you manage your network servers.
This AppNote is excerpted from the new book entitled Novell's ZENworks for Servers 3 Administrator's Handbook (Novell Press, ISBN 0-7897-2986-5). To order this and other Novell Press books, visit http://www.novellpress.com.
|
Topics |
server management, network management |
|
Products |
ZENworks for Servers 3 |
|
Audience |
network administrators |
|
Level |
beginning |
|
Prerequisite Skills |
familiarity with ZENworks for Servers 3 |
|
Operating System |
NetWare, Windows NT/2000 |
|
Tools |
none |
|
Sample Code |
no |
Introduction
One of the most difficult tasks enterprise network administrators must face is how to manage the numerous servers on their network. This AppNote discusses the powerful tools and services included with ZENworks for Servers 3 that help you manage your network servers.
Using ZENworks for Servers 3 SNMP Agents to Manage Servers
ZENworks for Servers 3 has several management agents that enable you to configure, monitor, and manage servers from a single console interface.
Understanding SNMP-based Server Management
One of the biggest advantages in using ZENworks for Servers 3 to manage your servers is that its server management agents support the industry standard Simple Network Management Protocol (SNMP). These ZENworks for Servers 3 server management agents also support the UDP/IP, IPX, and NCP implementations for packet sending. Therefore, any SNMP console or manager can request information from them.
The ZENworks for Servers 3 server management agents run on both NetWare and Windows NT/2000 Servers in your network. These agents continuously monitor the servers and collect dynamic data in response to requests from the management console.
ZENworks for Servers 3 uses several different management agents to manage servers.
Monitoring. The server monitoring agents provide instant information about the current state of the monitored elements of the server, including CPU utilization, memory size, available cache buffers, connected users, volumes, disks, disk space usage per user, network adapters, available print queues, current print jobs, and NLMs loaded on the server.
Trending. The server trend agents provide historical data about various server objects and can be displayed in a graphical diagram on the ZENworks for Servers 3 management console. The trend data is stored on the managed server, which eliminates the need for extra LAN traffic to poll the SNMP Agent Manager.
Alarm notification. The server alarm notification agents monitor for predefined alarms or events and then notify the ZENworks for Servers 3 management system (or any SNMP management console). Currently, ZENworks for Servers 3 agents monitor more than 580 different types of alarms or events. Any Windows NT/2000 system, security, or application event is converted to an SNMP trap and sent to the management system as well.
Configuration management. The server configuration management agents for NetWare servers enable you to remotely view and modify the NetWare server's configuration from the management console. The configuration management agent enables you to modify 187 SET parameters on the NetWare server to tune performance.
Note: The ZENworks for Servers 3 SNMP agents must be installed on every server you want to manage.
ZENworks for Servers 3 Management Views
The ZENworks for Servers 3 management agents provide information to the administrator's management console through the use of server management views. You can access the following three main types of server management views by selecting a server or network node from the ZENworks for Servers 3 namespace in ConsoleOne:
Console view. Provides details about the selected server or node. You can also drill down into the server configuration to display information about the internal component of the server[md]for example, operating system version, installed devices, and memory.
Summary view. Provides details about the server's current performance-for example, alarms generated by the server, CPU utilization, and available disk space. Once again, you can drill down into the server configuration and view summary information about its components-for example, processor, running threads, memory, and NetWare volumes.
Trend view. Provides a graphical representation of the trend parameters set up for the server. This enables you to monitor server's state trends over specific periods of time. Then, using this trend data, you can track the server's general health status and predict potential problems and needs for growth.
Planning Server Management
Now that you understand the ZENworks for Servers 3 management agents and the console interface used to monitor your server's state, you need to do a little planning to get the most out of the data that ZENworks for Servers 3 provides.
This section discusses how to use the data you obtain from the ZENworks for Servers 3 console views to create a baseline document. You then find out how to use that baseline document to monitor, troubleshoot, and optimize your servers.
Creating a Server Baseline Document
You should create a baseline document that defines the normal activity and usage of your network servers. This document is later used to identify atypical performance or problems on your servers.
You can create a baseline document either from data out of the Trend view or from a server health report. The following elements are vital for every baseline document:
CPU utilization. The CPU utilization statistic indicates how busy the processor is on the server. High CPU utilization greatly impacts the server's performance. CPU utilization rises and falls with user and network activity throughout each day. CPU utilization, for example, is usually high first thing in the morning when all the users are logging on to the server and reading email, or on Friday when large weekend reports are being run. You should create a daily, weekly, and monthly graph for your baseline document, if necessary, to map out an expected CPU utilization pattern.
Cache buffers. Cache buffers represent the amount of server memory usable for processes. The availability of cache buffers greatly impacts the server's performance. Once again, the available cache buffers rise and fall during the day based on users and application usage. You should typically have between 65-70% of your cache buffers available to applications. Create a daily graph for your baseline document showing the typical trend of cache buffers on your server.
File reads and writes. The file reads and writes by the server should also be graphed into a baseline document. This helps you determine whether a server is performing a high or low number of file I/Os.
Volume utilization. You should also create a graph showing typical volume usage as users create and delete files. This is useful in determining when you must add storage space to a volume.
Running software. Another useful parameter to add to a baseline document is the software running on the server. This helps you in network planning and troubleshooting software issues.
Using a Server Baseline Document
After you create a baseline document, you should keep it available and up to date. The following sections describe situations in which the baseline document can be useful.
Setting Alarm Thresholds.
The most useful function of a baseline document is its capability to help you understand what thresholds to set for servers monitored by management agents. You can use the baseline document statistics to set alarm threshold values that alert you when normal server usage is being surpassed-for example, the server starts running out of memory or disk space.
Tracking Server Utilization. Another useful function of a baseline document is to help you track server utilization. You can use the current and past data to evaluate the server's usage trends and understand needed configuration changes. You can, for example, use the baseline document to predict a volume running out of disk space, available cache buffers insufficient for running software, and so forth.
Server Troubleshooting. The final function of a baseline document is to aid you in troubleshooting your servers. Using the typical data in the baseline document, you can recognize atypical behavior of your servers, which will help you isolate the problem. For example, suppose that a server is running out of memory. You compare the baseline document to the server's current state and notice that the only difference is that a new application is running on the server. The first step in troubleshooting is to remove the application.
Displaying Server Configuration Information. Using the ZENworks for Servers 3 namespace in ConsoleOne, you can display and view critical configuration information about your servers. You can then use this information to manage and control the servers on your managed network. The following is a list of the configuration information components and information that you can retrieve about your managed servers through the ZENworks for Servers 3 namespace:
Processors. Processor number, type, speed, bus, and utilization
LAN adapters. Driver name, adapter number, MAC address, and usage
Disk adapters. Drive number and type
Storage devices. Drive number, vendor name, partition types, size, ID, redirection information, and fault tolerance
OS kernel threads. Thread name, parent NLM, execution time, state, stack size, and affinity
OS kernel interrupts. Interrupt name, number, number of occurrences, execution time, type, processor, service routines, and spurious interrupts
OS kernel memory. Memory type, size, maximum size, and usage
OS kernel address spaces. Space name, number of NLMs loaded, mapped pages, restarted bits, memory, and block usage
Network interfaces. Protocol name, board name, board number, packets out, packets in, address, and descriptions
Network connections. Connection number, username, client address, state, privileges, connection time, bytes read/written, NCP requests, open files, and locked files
Users. Username, disk usage, last login time, account and password status, real name, and bad logins
Installed software. Application name, type, and date installed
NetWare Loadable Modules (NLMs). Filename, version, release date, memory usage, description, copyright, and resource tag information
File services. Volume name, segment number, segment index, logical ID, physical ID, size, fault tolerance, and disk name
RMON services. Agent name and version, IP and/or IPX address, number of interfaces, current status, agent type, resources, owners, and indexes
To access the server configuration from within the ZENworks for Servers 3 namespace in ConsoleOne follow these steps:
Locate the Server object about which you want to display configuration information.
Click the + sign next to the Server object to expand the view. The view should expand to reveal the configuration devices, operating system, and services configuration data groups.
Click the + sign next to each of the data groups and data elements to reveal data about each configuration component, as shown in Figure 1.
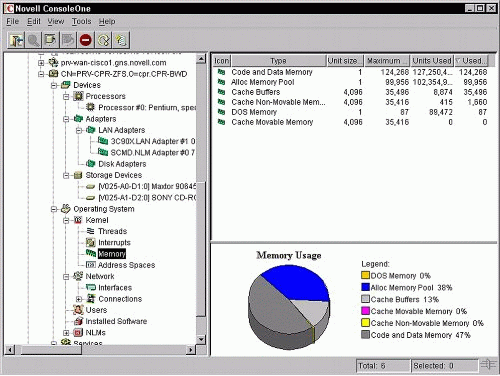
Figure 1: Server configuration groups and components located in the ZENworks for Servers 3 namespace in ConsoleOne.
Showing Server Summary Data
Displaying the configuration data for each individual component gives you a lot of extremely detailed and useful information. At times, however, you may want to take only a quick look at a server's configuration information. For this reason, ZENworks for Servers 3 also enables you to display a quick summary view of the most vital information about the managed server.
ZENworks for Servers 3 uses a series of SNMP GET requests to the ZENworks for Servers 3 management agents to create a quick collection of summary data. That summary data is dynamically updated by ZENworks for Servers 3 as it continuously polls the server.
To access the summary information about a server, right-click the Server object and then select Views > Summary from the pop-up menu. A screen similar to the one in Figure 2 appears.
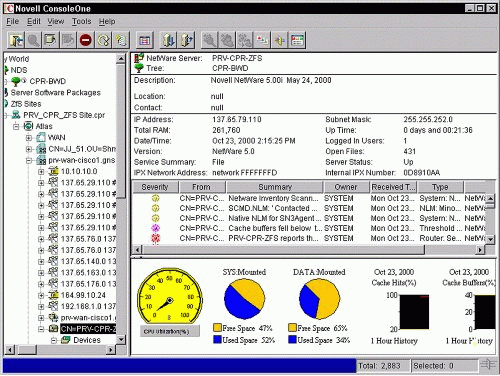
Figure 2: Server summary of a NetWare server, located in the ZENworks for Servers 3 namespace in ConsoleOne.
This summary screen shows the following information about the managed server:
Server Type. Tells you whether it is a NetWare server or an NT/2000 Server
Server Name. Lets you know for which server you are viewing the summary
Server Tree. Useful when troubleshooting eDirectory/NDS issues
Description. Tells you the server type, version, and revisions. This is useful in determining whether a support pack has been applied to the server
Location. If a Location field is set up for the server in the management database, that location shows up here. This is essential if you have a WAN with numerous servers located in several different buildings, cities, or countries.
Contact. Useful for finding the person responsible for the server, because most enterprise networks are partitioned and administered by several different people
IP Address. Gives you the IP address and subnet mask for the server
IPX Address. Gives you the IPX address and network number for the server
Total RAM. Indicates total RAM installed, which is useful in troubleshooting server problems
Up Time. Knowing the server's up time is very useful for things such as identifying when the server was last serviced, whether the server has been down recently, or whether the server has experienced critical problems and reset itself.
Date/Time. The current time that the server thinks it is. This is helpful if you are having any issues involving time synchronization in eDirectory.
Service Summary. Lists the services that are currently available on the server. This can be helpful if you are browsing servers to find a candidate to take on extra services.
Logged in Users. Gives you the number of users currently logged in to the server
Open Files. Gives you the number of files that are currently open on the server
Server Status. If for any reason the server cannot be contacted, the most recent summary data is collected and the server shows up as being down.
Managed Events. All events that are monitored by ZENworks for Servers 3 and that occur on the server are listed. This list can be extremely useful in understanding the current state of a server, because alarms are also listed.
CPU Utilization. Displays a speedometer of the current percentage of utilization of the server's CPU.
Volume Data. Displays the mount status and free and used space on the server's volumes.
Cache Activity. Displays a graph showing the history of the server's cache memory in terms of cache hits and percentage of free cache buffers.
Note: ZENworks for Servers 3 also enables you to display similar summary data for processors, LAN adapters, disk adapters, storage devices, threads, interrupts, memory, address spaces, interfaces, connections, users, installed software, NLMs, and volumes.
Viewing Trend Data
Trend data is another important aspect of your servers that ZENworks for Servers 3 enables you to view and monitor. ZENworks for Servers 3 is continuously gathering data about the trends in CPU usage, memory usage, and network traffic from the managed server as it is operating.
You can view the trend data from the management console in terms of current data or historically by day, week, month, or year. That trend data can be extremely useful in troubleshooting network and server issues, as well as understanding the current workload on the server.
You should monitor the trend data to help with decisions on setting trend alarm thresholds, determining peak usage of the server, balancing server loads, and allocating new resources. To view the trend data from the management console, right-click the server you want to monitor and select Views > Trend from the pop-up menu; a screen similar to the one in Figure 3 should appear.
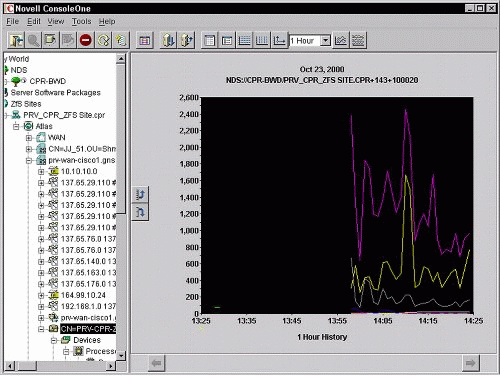
Figure 3: Trend Data view of a NetWare server, located in the ZENworks for Servers 3 namespace in ConsoleOne.
ZENworks for Servers 3 enables you to customize the Trend Data view to give you the data's maximum use. The following sections describe how to customize the Trend Data view by displaying the legend, modifying time spans, displaying grid lines, stacking/unstacking graphs, and modifying the Trend view profile.
Displaying the Legend. You must display a legend to understand the Trend Data view shown in Figure 3 and use it to understand the server's current status. The legend is simply a window that relates the trend data parameters used in the Trend Data view with its color of line shown on the graph. Viewing the legend helps you understand what trends are being displayed on the server so that the graph makes sense.
To view the Trend Data view legend, click the Legend icon in the Trend Data view toolbar (refer to Figure 3). A pane similar to the one in Figure 4 appears.

Figure 4: Legend window for the Trend Data view in ConsoleOne.
Modifying Time Spans. After you view the legend and understand what parameters the graph is showing you, you can modify the time spans for the trend data to best understand how the server is doing. You can modify the time span by clicking the down arrow on the toolbar of the Trend Data view and selecting one of the following time spans:
1 Hour. Use the 1 Hour time span to show you the server's current status. At 9:00 a.m., for example, you may want to view the 1 Hour span to see how the server is doing during the morning login.
1 Day. Use the 1 Day time span to see how the server did over the past 24 hours. This can be useful to see how the server performed over a workday, or overnight while reports and backups were running.
1 Week. Use the 1 Week time span to monitor your servers week to week. This is the most commonly used time span to judge a server's overall usage and performance.
1 Month. Use the 1 Month time span to monitor the long-term performance of your server. This can be helpful in determining increased workload trends.
1 Year. Use the 1 Year time span to compare the usage of your servers over the past year. This can help you determine where more servers are needed or where you can reallocate users.
Displaying Grid Lines. Another task you can perform in the Trend Data view is to display horizontal and vertical grid lines. The grid lines make the graphs easier to read. You can turn on and off the horizontal grid lines by clicking the Horizontal Grid button on the Trend Data view toolbar. Conversely, you can turn on and off the vertical grid lines by clicking the Vertical Grid button on the Trend Data view toolbar.
Stacking and Unstaking Graphs. One of the most useful ways to customize your Trend Data view is to stack and unstack the graphs. Stacking the graphs means that they are all overlaid on top of each other on a single graph with several lines for all parameters. Unstacking the graphs makes several different graphs, each with its own line for a single parameter, as shown in Figure 5. (Figure 3 shows what a graph would look like stacked.)
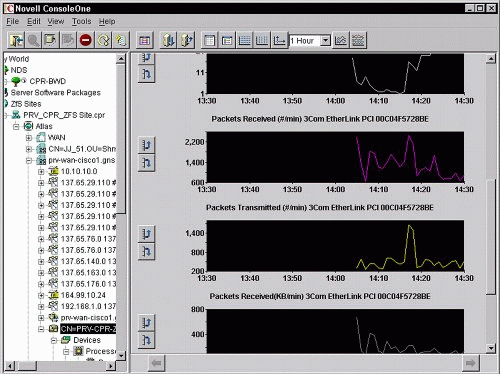
Figure 3: Unstacked Trend Data view of a NetWare server, located in the ZENworks for Servers 3 namespace in ConsoleOne.
To stack the graphs on top of each other, click the Stack Chart button on the Trend Data view toolbar. To unstack the graphs, click the Strip Chart button on the Trend Data view toolbar.
Modifying the Trend Data View Profile. The biggest way to modify the Trend Data view is to modify the Trend Data view profile. The Trend Data view profile is basically the set of parameters that are displayed on the Trend Data view graph. You should modify the Trend Data view profile to best fit your servers and your environment. Follow these steps to modify the Trend Data view profile:
Click the Profile button on the Trend Data view toolbar. A window similar to the one in Figure 6 appears.
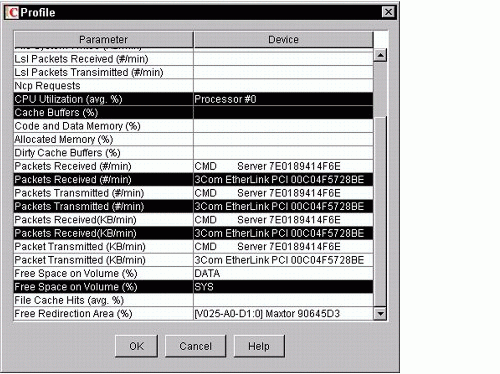
Figure 6: Trend Data view profile settings window for the Trend Data view in ConsoleOne.
Edit the profile by clicking the parameters to either select or deselect them. Use the <Shift>+click and <Ctrl>+click methods to select multiple parameters.
Click OK to apply the setting; the Trend Data view should be updated.
Managing Trend Samplings
Now that you understand how to view the trend data, you need to know how to manage the way that the data is collected. ZENworks for Servers 3 enables you to modify the trend data sampling rates and thresholds used to collect the data. The following sections discuss how to use the management console to customize trend sampling to fit your network.
Modifying Trend Samplings and Intervals. The first step in managing trend sampling is to set the sampling and interval rates for trend parameters. Setting the sampling rate effectively determines the duration for which data from a particular parameter is collected by specifying the number of samples to take. Setting the interval rate determines how often data is collected from a particular parameter. Follow these steps to set the sampling and intervals for trend data parameters:
Right-click the Server object and select Properties from the pop-up menu.
Select the Trend tab, as shown in Figure 7.
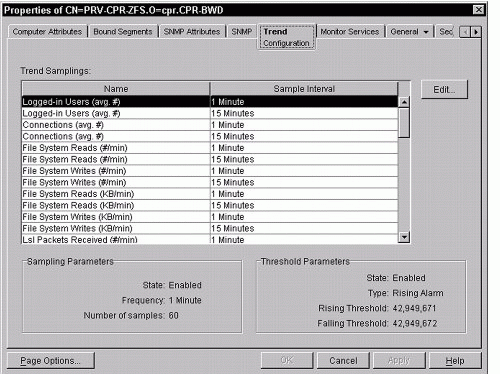
Figure 7: Trend tab for a managed server object in ConsoleOne.
Select the trend parameter you want to modify and click the Edit button. An Edit Trend dialog box appears.
From the State drop-down list in the Edit Trend dialog box, shown in Figure 8, select Enabled to enable trend sampling for the parameter.
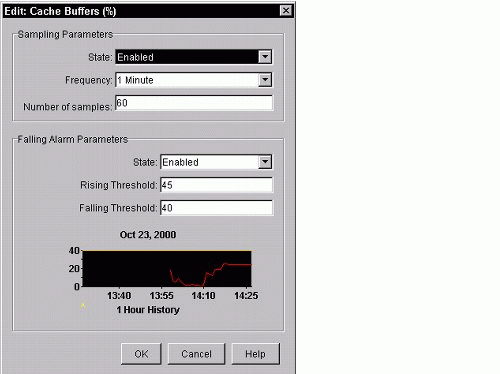
Figure 8: Edit Trend dialog box for trend data parameters in ConsoleOne.
Modify the time interval by selecting a value from the Frequency drop-down list. Values are from five minutes to one day.
Specify the duration of time for which to collect samples by entering a value in the Number of samples field.
Click the OK button and the parameter is modified.
Modifying Threshold Alarm Settings. After you set the sampling and interval rates for the trend data parameter, you need to set the threshold alarm settings for the parameter. Modifying the threshold alarm settings for a particular parameter controls the range at which the parameter can operate before triggering an alarm. It also controls the scope of the graph in the Trend Data view. Follow these steps to modify the threshold alarm setting for a trend data parameter:
Follow Steps 1-3 from the preceding section.
From the Edit Trend dialog box, shown in Figure 8, select Enabled in the Alarm section to enable trend sampling for the parameter.
Set the Rising Threshold to a value that reflects a safe amount for the parameter.
Set the Falling Threshold to a value that reflects an unhealthy state for the parameter.
Click the OK button and the parameter is modified.
Note: An alarm is sent the first time the rising threshold is surpassed, and if the parameter never dips back below the falling threshold, an alarm is not re-sent. In other words, for an alarm to be sent again after it has already been sent once, the parameter has to dip down below the falling threshold and then surpass the rising threshold again.
Configuring Server parameters
Another server management innovation that ZENworks for Servers 3 provides is the capability to modify server parameters without being at the server itself or having a remote management session open to it. ZENworks for Servers 3 enables you to modify the managed server's eDirectory object to make changes to its parameters. Follow these steps to modify server parameters from within ConsoleOne:
Select the Operating System resource under the NetWare Server object in the atlas namespace.
Right-click the Operating System resource and select Properties from the pop-up menu.
Select the Set Parameters tab.
Click the down arrow and select the category of set parameters you want to change from the drop-down list, as shown in Figure 9.
Set Parameters tab for Server objects in the atlas namespace in ConsoleOne.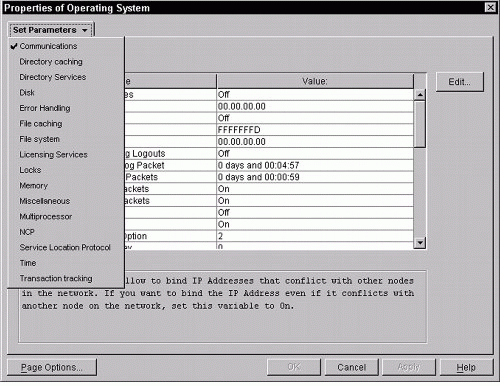
Select the specific parameter you want to modify, and then click the Edit button.
From the Edit Parameters dialog box, shown in Figure 10, enter the new value for the parameter into the field. (The field type changes based on the parameter selected.)
Set Parameters tab for Server objects in the atlas namespace in ConsoleOne.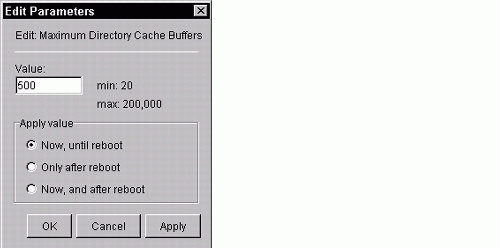
Indicate when you want the change to occur by selecting one of the following times: "Now, Until Reboot" (the change disappears after the server is rebooted), "Only After Reboot" (the change does not take effect until the server is rebooted), or "Now, and After Reboot" (the change is made immediately and permanently).
Click the OK button and the change to the parameter is made according to the criteria you selected.
Note: The preceding steps are a way to manually change set parameters on a server-by-server basis. If you want to do this on more than one server at a time throughout your network, you would use the Server Policy Package-Set Parameters policy in the policies piece of ZENworks for Servers 3.
Executing Server Commands
Another server management innovation that ZENworks for Servers 3 provides is the capability to execute server commands without being at the server itself or having a remote management session open to it.
Earlier in this AppNote, you learned how to navigate the Server object portion of the ZENworks for Servers 3 namespace to view configuration data. You can also use the server level of the ZENworks for Servers 3 namespace to execute server commands at the server level or below.
ZENworks for Servers 3 enables you to execute the following server commands from the ZENworks for Servers 3 namespace area in ConsoleOne:
Loading and unloading NLMs. You can load or unload an NLM by right-clicking the NLM object in the ZENworks for Servers 3 namespace and selecting Load or Unload from the Actions menu.
Mounting and dismounting volumes. You can mount or dismount a volume by right-clicking the volume object in the ZENworks for Servers 3 namespace and selecting Mount or Dismount from the Actions menu.
Clearing a server connection. You can clear a server connection by right-clicking the connection in the ZENworks for Servers namespace (Server > Operating System > Network > Connections) and selecting "Clear Connection" from the Actions menu.
Restarting a server. You can restart a server by right-clicking the server object in the ZENworks for Servers 3 namespace and selecting Restart Server from the Actions menu.
Shutting down a server. You can shut down a server by right-clicking the server object in the ZENworks for Servers 3 namespace and selecting "Down Server" from the Actions menu.
Managing Remote Servers
Managing servers remotely has become an industry standard as companies have increased the number of servers, which requires large data centers. ZENworks for Servers 3 greatly enhances the capability to remotely manage servers through the addition of applications that enable you to remotely take control of the server. The following sections describe how to use the ZENworks for Servers 3 management console to remotely manage a server.
Managing Remote NetWare Servers
ZENworks for Servers 3 includes the capability to use the RCONSOLEJ utility provided with NetWare to remotely manage a server from the management console. This enables you to manage NetWare servers based on your role in the organization and tasks assigned to you.
You can use the ZENworks for Servers 3 remote management capability to perform the following role-based remote management tasks on a managed NetWare server:
Console commands. Remotely execute console commands as if you were at the server. You may, for example, want to execute a command to start or stop an eDirectory trace.
Scan directories. Scan directories looking for installed software, data files, or file locations.
Edit text files. Edit text files on both NetWare and DOS partitions to modify scripts or other files.
Transfer files. Send files to the server to update an application or data. You cannot transfer files from a server for security reasons.
Install or upgrade. Perform an install or upgrade. You can, for example, remotely install the latest NetWare support pack to the server.
Follow these steps to begin a remote management session with a NetWare server from the ZENworks for Servers 3 management console on an IP-only server:
Load the RCONSOLEJ agent (RCONAG6.NLM) on the NetWare server.
Right-click the server object in ConsoleOne and select Actions > Remote Console from the pop-up menu.
Enter the RCONSOLEJ agent password.
Enter the TCP port number on which the agent will listen for requests from RCONSOLEJ. (The default value is 2034.)
Click the Connect button and an RCONSOLEJ session similar to the one shown in Figure 11 loads.
RCONSOLEJ remote management session launched from ConsoleOne.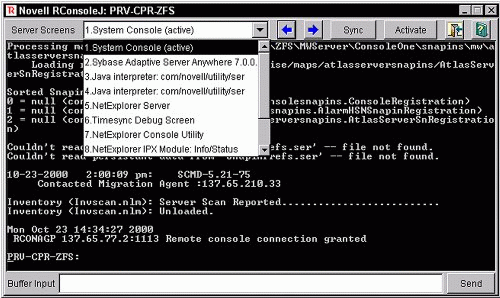
Follow these steps to begin a remote management session with a NetWare server from the ZENworks for Servers 3 management console on an IPX-only server:
Load the RCONSOLEJ agent (RCONAG6.NLM) on the NetWare Server.
Right-click the server object in ConsoleOne and select Actions > Remote Console from the pop-up menu.
Enter the RCONSOLEJ agent password.
Enter the TCP port number on which the agent will listen for requests from RCONSOLEJ. (The default value is 2036.)
Enter the IP address of the proxy server or choose a proxy server in the Proxy Server options section of the RCONSOLEJ window. The server acting as a proxy server for the RCONSOLEJ session needs to be running both IP and IPX so that it can communicate with both the workstation and the IPX server.
Enter the SPX port number on which the agent is to listen for requests from the proxy server. (The default value is 16801.)
Click the Connect button and an RCONSOLEJ session similar to the one already shown in Figure 11 loads.
Managing Remote NT/2000 Servers
ZENworks for Servers 3 adds the capability to remotely manage a Windows NT/2000 Server from the management console. This enables you to manage Windows NT/2000 Servers based on your role in the organization and tasks assigned to you.
You can use the ZENworks for Servers 3 remote management capability to perform the following role-based remote management tasks on a managed Windows NT/2000 Server:
Remote control. Enables you to remotely take control of a Windows NT/2000 Server to resolve any software-related problems and perform any administraRemote view. Enables you to remotely view the desktop of the Windows NT/2000 Server. This enables you to monitor activity on the NT server and see when actions are performed.tive tasks.
Remote view. Enables you to remotely view the desktop of the Windows NT/2000 Server. This enables you to monitor activity on the NT server and see when actions are performed.
Follow these steps to begin a remote management session with a Windows NT/2000 Server from the ZENworks for Servers 3 management console:
Verify that the remote management agent installed with the ZENworks for Servers 3 install is running on the Windows NT/2000 Server you want to manage.
Select the Server object from within ConsoleOne.
Select Tools > Remote Management > Windows.
Specify the Agent to use to initiate the remote management session.
Select Remote Control or Remote View from the drop-down menu.
Enter the password for the ZENworks for Servers 3 remote management agent. The remote management session should activate.
Note: During a remote management session, the user of the Windows NT/2000 Server receives an audible signal indicating that it is being accessed. Every five seconds the user receives a visible signal displaying the name of the user accessing the remote server. These settings can be changed by selecting Edit Security Parameters from the Remote Management icon's pop-up menu on the remote server's taskbar.
Optimizing Server Management
Now that you understand how ZENworks for Servers 3 uses trend data and alarm thresholds to help you manage your servers, you need to know how to optimize the data that ZENworks for Servers 3 gathers for you. When a managed server is first started, agents for trend data, alarm thresholds, and alarm management are loaded and begin collecting data. The best way to optimize server management is to control the initial settings that are loaded on your servers.
The following sections describe how to modify the configuration files that initialize the server management agents to give you tight control over the information collected and presented at the management console.
Setting Initial Trend Values
The first configuration file you should know how to modify is the trend initiali- zation file. This file sets the initial trends for monitoring a device. Each time a new managed device is discovered on the server, a trend file is created for it.
The trend initialization file is named NTREND.INI on a NetWare server and N_NTREND.INI on a Windows NT/2000 Server. The following sections describe how to use a text editor to modify the initial trend file shown in Figure 12.
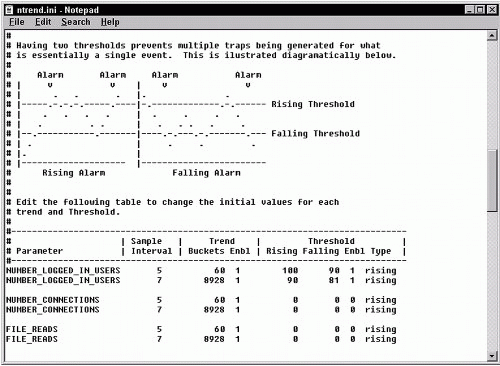
Setting the Sample Interval. The first column in the trend initialization file is the parameter name, and the second is the sample interval. The sample interval indicates the frequency that samples of the specified parameter are collected in terms of a time interval between five seconds and one day.
Evaluate each parameter to determine how often it should be sampled. If you sample too often, you run the risk of poor performance. But if you don't sample enough, you run the risk of incomplete or inaccurate information. Use the codes listed in Table 1 to set the sample interval for each trend data parameter.
Sample Interval Codes for Trend Initialization.
|
Trend Initialization Code
|
Sample Interval Rate
|
|
1 |
5 seconds |
|
2 |
10 seconds |
|
3 |
15 seconds |
|
4 |
30 seconds |
|
5 |
1 minute |
|
6 |
5 minutes |
|
7 |
15 minutes |
|
8 |
30 minutes |
|
9 |
1 hour |
|
10 |
4 hours |
|
11 |
8 hours |
|
12 |
1 day |
Setting the Trend Buckets. After you set the sample interval for the trend data parameters, you need to set the number of trend buckets in the third column. Setting the number of trend buckets determines the duration of time for which samples will be collected for the parameter.
If, for example, you want to review the number of users logged in to a server for one day and you set the sample interval to be 30 minutes, you need to specify 48 trend buckets. Each bucket contains one sample taken at a 30-minute interval.
After a particular time duration is exceeded for a file, the oldest trend buckets are emptied and replaced with the most recent samples. Therefore, after the duration has been reached, you will always have samples for that amount of time from the present backward.
Enabling and Disabling Trend Files. The fourth column in the trend initialization file is the Enable Trend Data option. This value can be set to either 0 or 1. Specifying 1 enables the gathering of trend data for this parameter. Specifying 0 disables the gathering of trend data for the parameter.
Setting Initial Threshold Values
After setting up the initial trend values, you need to specify the threshold values for alarm generation. Alarm thresholds control the values at which alarms are generated.
Two values are associated with these thresholds: a rising limit and a falling limit. For rising thresholds, the rising limit is the value at which an alarm is generated for the parameter. The falling limit, for rising thresholds, is the value at which the alarm is reset. They work conversely for falling thresholds. This way, an alarm is generated only when a server goes from a good condition to a bad condition-not if it simply stays in a bad state.
If, for example, you have set a falling threshold on cache buffers and a falling limit of 30% and a rising limit of 50%, the server would send out an alarm if cache buffers got below 30%. If the cache buffers then wavered between 25-35%, only the one alarm would be sent. But if the servers' cache buffers climbed back up to 60% and then back down to 30%, a second alarm would be sent.
Setting Rising and Falling Thresholds. The fifth and sixth columns in the trend initialization file are the rising and falling limits, respectively. They represent a value that indicates a problem for the trend parameter and a value that indicates the trend parameter is out of trouble.
You need to evaluate each parameter to determine the appropriate threshold limits and specify them in their columns. You also need to specify which type of threshold the parameter has by putting "rising" or "falling" in the Type column of the trend initialization file.
Enabling and Disabling Threshold Traps. After you specify the limits, you can enable or disable the threshold trap by specifying 0 or 1 in the seventh column. Specifying 0 disables alarm generation for the parameter. Specifying 1 enables alarm generation for the parameter.
Configuring Alarm Generation
The next configuration file you should know how to modify is the trap configuration file, which controls alarm generation. The trap configuration file consists of keywords with associated information about alarm generation.
The trap configuration file is located in the following locations on the managed servers:
NetWare: SYS:\ETC\NWTRAP.CFG
Windows NT/2000: \MW\INI\NTTRAP.INI
The following sections describe how to modify the trap configuration file, shown in Figure 13, to modify the types of alarms forwarded to management consoles, community strings used for sending SNMP traps, traps to be disabled, and specific alarms that you want to prevent from being forwarded.
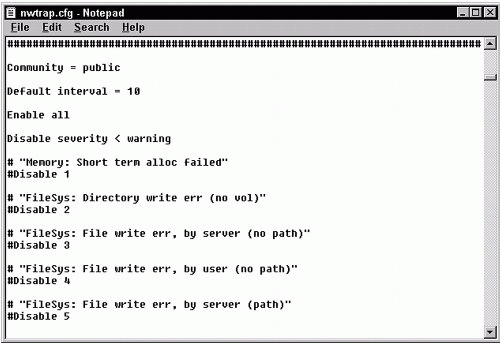
Setting the Community String. The first thing you can set in a trap configuration file is the community string. The community string is used to generate traps and is restricted to 32 characters. The default community string is "public".
Setting the Time Interval. After setting the community string, you need to specify the time interval that alarm generation waits before issuing the next alarm. This is to prevent the network and management console from being inundated with identical alarms. The time interval can be any value between 0 and 232.
If, for example, you want to set the amount of time between alarms for traps 5, 10, and 100 to 20 seconds, you would use the following command in the trap configuration file:
5 10 100 INTERVAL = 20
Configuring Alarm Security Levels. After you specify the time interval for alarms, you should set the severity levels for alarm generation. Each SNMP alarm has a severity level associated with it. You can specify at what severity level to generate alarms so that only those alarms are actually sent to the management console.
You can use the ENABLE and DISABLE commands, with a severity level code or number, in the alarm configuration file to control which severity levels to pass through. Table 2 shows the severity levels for alarm generation and the associated codes for the configuration file.
Severity Levels and Codes for Alarms.
|
NetWare Severity
|
SNMP Severity
|
ZfS Severity
|
Severity Code
|
|
0-Informational |
Informational |
Informational |
INFORM |
|
1-Warning |
Minor |
Minor |
WARN |
|
2-Recoverable |
Major |
Major |
MINOR |
|
3-Critical |
Critical |
Critical |
MAJOR |
|
4-Fatal |
Fatal |
Critical |
CRITICAL |
|
5-Operation Aborted |
Fatal |
Critical |
CRITICAL |
|
Unrecoverable |
Fatal |
Critical |
CRITICAL |
The following are examples of specifying severity levels in the configuration file:
ENABLE SEVERITY >= MINOR DISABLE SEVERITY <= WARN
Defining Alarm Recipients. The final configuration file you should know how to modify to optimize server management is the TRAPTARG.CFG file. The TRAPTARG.CFG file is used to send traps to third-party management consoles. It defines recipients of SNMP traps that are detected on the server.
If you plan to use third-party management consoles or utilities to monitor SNMP traps, you need to add their IP addresses or IPX addresses to the TRAPTARG.CFG file for alarms to be sent to them.
Follow these steps to modify the TRAPTARG.CFG file:
Open the file in a text editor.
Add the IPX network number and MAC address of any management consoles to the IPX section of the TRAPTARG.CFG file-for example, FFFF1111:00001B123456.
Add the IP address or logical name of any management consoles, if you have DNS configured, to the UDP section of the TRAPTARG.CFG file-for example, 111.111.5.2. If DNS is configured in your network, you can use the logical name.
Save the file.
Unload and reload NWTRAP.NLM on the agent server.
Using ZENworks for Servers 3 Server Inventory
Another important component of ZENworks for Servers 3 server management is server inventory. ZENworks for Servers 3 uses inventory scan programs to scan and store hardware and software inventory of your managed servers. The following sections describe the inventory components and discuss how to scan server inventory and customize software scanning.
Understanding Server Inventory Components
To get the most out of ZENworks for Servers 3 server inventory, you need to understand the components that make up the inventory process and roles that inventory servers play in capturing and storing inventory data.
In a small network, one inventory server would be ample to collect, store, and provide access to the inventory data about servers. But in enterprise networks, the number of servers and the amount of inventory data that can be collected and managed becomes extremely complex. For that reason, ZENworks for Servers 3 implements a tree design to allow several inventory servers to be involved in accumulating and distributing the inventory data. The following is a list of the types of inventory servers and their roles in the inventory process:
Standalone server. The standalone server is used in small networks where only one server and database is needed for collecting and storing inventory data from the network. The standalone server collects the inventory data and stores it in a local database.
Root server. In an enterprise network, you need to implement several inventory servers to collect and store inventory data. The first inventory server you create is a root server that acts as the top-most level for the inventory tree. The root server must have an inventory database stored on it to store data collected from the other inventory servers below it in the tree.
Intermediate server. If you have a large network, you also need to create intermediate servers. The intermediate server collects data from servers below and passes that data to either another intermediate server above, or to the root server. An intermediate server can have an inventory database attached to it to store inventory information locally, but that is not required.
Leaf server. The leaf server is the bottom-most level of the tree. Leaf servers are responsible for collecting inventory data that has been scanned, and then passing that data up to the next level in the inventory tree. The leaf server can send data either to an intermediate server or the root server. It can also have an inventory database attached to it to store inventory information locally, but that is not required.
Now that you understand the types of inventory servers that are involved in the server inventory process, you need to understand the components that are involved. ZENworks for Servers 3 uses several different pieces to scan servers for inventory data, process that information, and then store it in the appropriate location. The following is a list of components that make up the inventory process:
Inventory scanners. Inventory scanners are agents that run on managed servers that are responsible for scanning the server's hardware and software. They collect the data each time they are run and store that data in a file.
Selector. The selector processes the data scanned by the inventory scanners and selects new data that should be added to the inventory database. It then places those scanned files into appropriate directories.
Sender and receiver. The sender and receiver are utilities that run on servers to transfer scanned files from an inventory server to the next level of server in the inventory tree.
Inventory storer. The inventory storer is a utility that runs on an inventory server with an inventory database attached. It is responsible for taking the inventory scan files that the server receives and storing the inventory data in the database.
Inventory database. The inventory database is an RDBMS maintained by Oracle or Sybase or a Microsoft SQL Server and acts as the repository for the hardware and software inventory data collected by the inventory scanners. You can access the data in the inventory database through management console reporting, as well as through user-customized database queries.
Understanding the Scanning Process
Now that you understand the types of inventory servers and the software components that are involved in ZENworks for Servers 3 server inventory, it is helpful for you to understand the actual process using ZENworks for Servers 3 to scan, collect, and store inventory data.
The first thing that happens in the inventory process is that the inventory scanner agent is activated on a Windows or NetWare Server. The agent reads inventory policy settings (discussed later in this AppNote) and uses those settings to scan the server. As the scanning agent runs, it collects data about the server's hardware and software and stores that data in .STR files on the server's local file system. The scan collector then transfers those files to the scan directory (\SCANDIR\) of the inventory server defined in the inventory policy.
After the inventory scanner places data in the scan directory, the selector begins to process the .STR files. The selector filters out everything but new inventory data, and then stores the new data in the enterprise merge directory (\ENTMERGEDIR\) to be transferred to a higher level and/or to the database directory (\DBDIR\) to be stored in the inventory database, if one is running on the server.
After files are stored in the enterprise merge directory, the sender zips up all the scan data files and sends them to a receiver running on another inventory server, which is defined in the roll-up policy (discussed later in this AppNote).
The receiver opens the .ZIP files it receives from a sender and copies them to the enterprise merge directory (\ENTMERGEDIR\) to be transferred to a higher level and/or to the database directory (\DBDIR\) to be stored in the inventory database, if one is running on the server. On an intermediate server with an inventory database, for example, the files would be copied to both directories; however, on the root server the files would be copied to only the database directory.
After files are placed, the storer opens the .ZIP file, extracts the scan files to a temp directory (\DBDIR\TEMP\), and updates the inventory data with the data in the .STR files. After the database is updated, the administrator can view the new inventory data from the management console.
Setting Up Server Inventory
Now that you understand the components that are involved in the ZENworks Server Inventory process, you need to understand how to set up and configure the eDirectory objects that control inventory scanning. You use the management console to define the database types and locations in the inventory tree, as well as their synchronization and roll-up schedules. The following sections discuss the configuration changes you need to make at the management console to configure and customize server inventory.
Configuring the Inventory Service Object. The first object you need to configure for server inventory is the inventory service. You must create an inventory service object for each server on which you install ZENworks for Servers 3. The inventory service object defines which role that server plays during the server inventory process. (The inventory service object can be created automatically during the installation of ZENworks for Servers.)
To configure the inventory service object for an inventory server, right-click the inventory service object in ConsoleOne and select Properties. Then select Inventory Service Object Properties from the drop-down list of the Inventory Server Object tab, as shown in Figure 14.
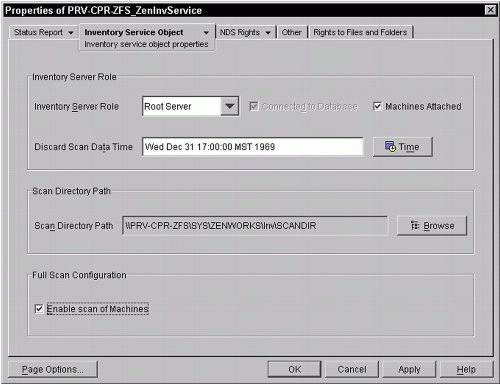
From the Inventory Service Object Properties panel, you can configure the following items of the inventory server:
Inventory Server Role. Select the role of the server (Standalone, Root, Intermediate, or Leaf) from the drop-down list. Then you need to define whether it has a database connected by selecting the Connected to Database box (Intermediate and Leaf only). You also need to specify whether machines are connected to this service (Root and Intermediate only).
Discard Scan Data Time. Defines a date and time to discard all scan data and start with a fresh copy.
Scan Directory Path. Defines the location on the inventory server where the scan data files are to be stored when a scan is run.
Enable Scan of Machines. Enables you to temporarily disable scanning of machines. This option is useful if you need to reduce server or network traffic for troubleshooting or performance reasons.
ZENworks for Servers 3 enables you to configure the synchronization schedule to synchronize servers being inventoried with the inventory server with which they are associated. To configure the synchronization schedule for an inventory server, right-click the inventory service object in ConsoleOne and select Properties. Then select Inventory Server Sync Schedule from the drop-down list of the Inventory Server Object tab, as shown in Figure 15.
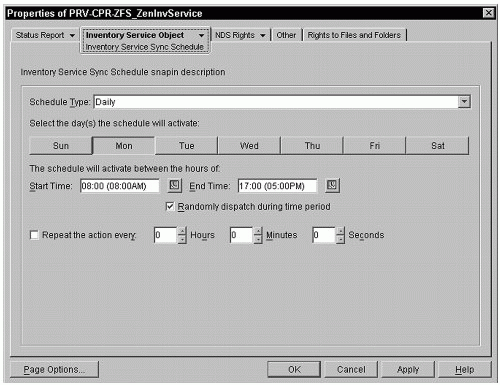
From the Inventory Service Sync Schedule panel, you can configure the following synchronization options for the inventory server:
Schedule Type. Determines whether the synchronization is a daily, weekly, or monthly type, or whether it should use the policy package to determine its schedule.
Days Active. Enables you to specify, by clicking the day's button, which days the schedule will be active. This is useful for performance reasons. If no changes occur over the weekend, for example, but you are performing network-intensive backups, then you would not select Saturday and Sunday.
Start and End Time. Enables you to specify the start and stop time for inventory to occur. This enables you to control what times during the day inventory can run. By setting the stop time to 8:00 a.m., for example, you could have inventory stop at 8:00 a.m. before users begin logging on to the network.
Random Dispatch Time. Enables you to have ZENworks randomly start the synchronization between the start and end times.
Repeat. Enables you to have ZENworks repeat the synchronization at the specified interval. This can be extremely useful if you are watching software inventory that changes frequently.
Configuring the Distributed Server Inventory Policy. After configuring the Inventory Service object, you need to configure server inventory policy for distributed server packages that you want to use to collect and distribute inventory data. The server inventory policy enables you to configure which inventory service the servers associated with this package are to use. It also allows you to enable and configure hardware and software scanning.
To configure the server inventory policy for a distributed server package, right-click the package and select Properties from the drop-down menu. Then select the Policies tab for the operating system you want to configure. ZENworks for Servers 3 enables you to select NetWare, Windows, Linux, Solaris, or General to configure for all those operating systems. Next, enable the server inventory policy by checking the box next to it. Finally, select the server inventory policy and click the Properties button to bring up the Server Inventory Policy Properties window. The following sections discuss how to configure the server inventory policy from this window.
Configuring the Inventory Service for the Server. The first step in configuring the server inventory policy is to configure which inventory service the servers associated with this policy are to use. Select the General tab in the Server Inventory Policy panel, as shown in Figure 16.
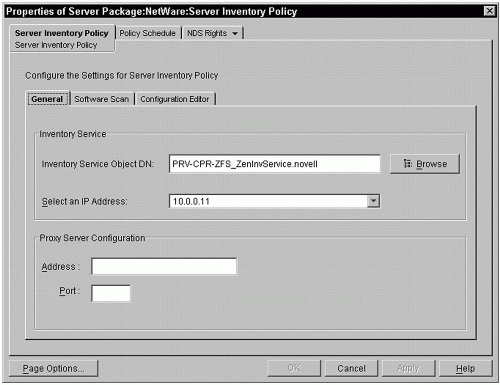
Configure the following settings:
Inventory Server Object DN. Use the Browse button to navigate through the eDirectory tree and locate the inventory service policy, the correct roll-up schedules, and locations configured for servers associated with this distributed server package.
Server IP Address/DNS Name. After selecting the inventory server object, you need to select the IP address or DNS name to use for connecting to the inventory database. Make certain that you select the correct name or address or the inventory servers will be unable to connect to the inventory service database.
Proxy Server Configuration. Leave Proxy Server Configuration alone; you do not need to configure it for server inventory.
Configuring Hardware Scan. If you are configuring an inventory server policy for Windows, then you need to configure hardware scanning by selecting the Hardware Scan tab and setting the following options:
Enable DMI Scan. Enables ZENworks to collect hardware inventory data from Windows NT/2000 workstations by using the Desktop Management Interface (DMI) 2.0 specification. (DMI drivers are usually available through the vendor of the hardware platform.)
Enable WMI Scan. Enables ZENworks for Servers 3 to collect hardware inventory data from Windows NT/2000 workstations by using the Web-based Management Interface (WMI) 1.5 specification. (WMI drivers are included in the Windows system.)
Configuring Software Scan. Next you need to configure software scanning. Enable software scanning by checking the box next to the Enable Software Scan option, and then clicking the Custom Scan Editor button to bring up the Custom Scan Editor window (see Figure 17).
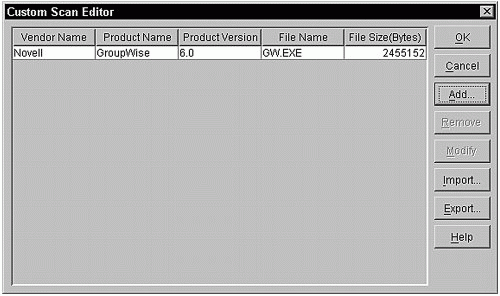
If you are configuring a server inventory policy for Windows, then you also have the option to enable ZENworks to scan for product identification numbers of applications that are installed on inventoried Windows NT/2000 Servers. The product identification number can be extremely useful in sorting and organizing inventory software reports.
From the Custom Scan Editor window, you can create a list of software that ZENworks for Servers 3 will scan for on servers during the inventory process. The Custom Scan Editor provides you with a powerful tool to optimize software scanning for your network. Use the Custom Scan Editor to specify the vender, product name, product version, filename, and file size of the software for which you want to scan on servers. This enables you to selectively inventory only software that is important to track, reducing the size of inventory reports as well as network and server utilization.
Configuring the Configuration Editor. After you enable and configure software scanning, you can modify the INI file that ZENworks for Servers 3 uses when reporting software inventory by selecting the Configuration Editor tab, as shown in Figure 18. From the Configuration Editor tab, you can edit the SWRules file by clicking the Set Default button to open the default file, and then modifying the entries. This enables you to modify what information ZENworks includes when you create inventory reports.
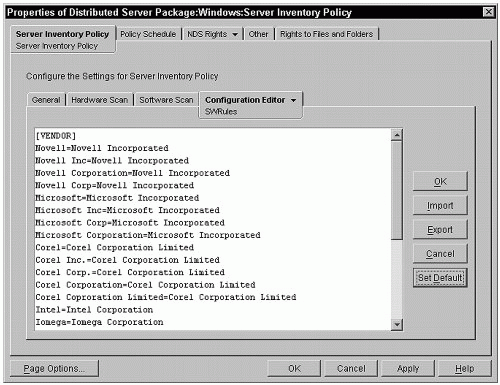
If you are modifying the server inventory policy for Windows, then the Configuration Editor tab will have a drop-down arrow enabling you to modify the entry's INI files for Zipped Names. This modification enables you to specify the manufacturers of software that is being used to zip files, as well as the identifiers that they are using for the zipped files.
If you are modifying the server inventory policy for Windows, you can also modify the entries in the INI file for Asset Information. You can specify the DMI classnames and attributes for things such as a server model, model number, serial number, and computer type.
Configuring the Service Location Package
The next step in configuring server inventory is to define the inventory database for the service location package object and associate the database object with the inventory service object. This step tells ZENworks which inventory server to use for objects associated with the service location package. Follow these steps to configure the service location package from within ConsoleOne:
Create and/or select the service location package.
Right-click the service location package object and select Properties from the pop-up menu; then select the NetWare or Windows Policies tab.
Enable the ZENworks database policy by checking the box next to it. Click the Properties button to open the Database Properties window.
Select the Inventory Management Tab; then click the Browse button to find the inventory database object you want to use for the service location. Click OK.
When you return to the Properties page for the service location package, select the Associations tab.
Click the Browse button and select the container that stores the inventory service object you want to associate with the inventory database you defined for the service location package. Click OK.
Click Apply to configure the service location package.
Configuring the Roll-Up Policy
After configuring the service location package, you need to configure the roll-up policy if this inventory server is a leaf or intermediate server. The roll-up policy controls the flow of scanned data through the inventory tree by determining the next inventory location and schedule-to-roll scan data collected by the current inventory server. Follow these steps to configure the roll-up policy for an inventory server in ConsoleOne:
Create and/or select the Server Package object that is associated with the inventory server.
Right-click the Server Package object and select Properties from the pop-up menu; then select the NetWare or Windows Policies tab.
Enable the roll-up policy by checking the box next to it. Click the Properties button to open the roll-up policies window, as shown in Figure 19.
Inventory Server Sync Schedule panel of an inventory service object of a ZENworks for Servers 3 inventory server.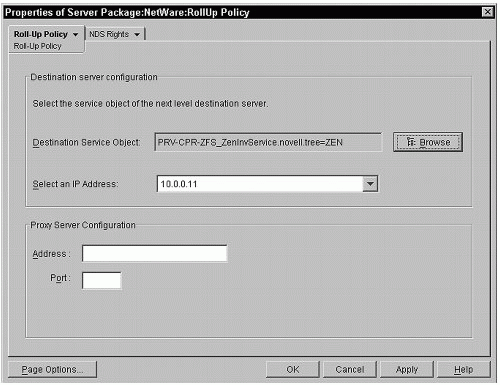
Click the Browse button and navigate to the inventory service object of the intermediate or root server to which you want this server to roll-up scan data. Click OK.
Select the IP address of the next level inventory server.
Select the Roll-Up Schedule tab and configure the schedule of when to roll scan data collected by this server up to the next level. You need to keep in mind the synchronization schedule defined for the inventory server when configuring the roll-up schedule so that there are no conflicts and there is minimal lag time. If the inventory synchronization, for example, runs only monthly, then you want the roll-up to occur after the synchronization is complete to avoid a one-month latency of information being rolled up in the tree. (See the "Configuring the Inventory Service Object" section and Figure 15, earlier in this AppNote, for more information about the schedule page.)
Click the OK button to return to the Server Package Properties page.
Select the Associations tab and click the Add button.
Browse to the inventory server object you want to associate with this server package. Click OK twice to return to the Server Package Properties page.
Click the Apply button to configure the roll-up policy.
Conclusion
This AppNote has shown you how to use the server management features of ZENworks for Servers in your system. You can also use other ZENworks for Servers features to enhance the manageability of your network. For more information, review the ZfS online documentation found at http://www.novell.com/documentation/lg/zfs302/index.html.
For updates and additional information, refer to the following Web sites:
http://www.novell.com/zenworks
http://www.novell.com/coolsolutions/zenworks
http://www.novell.com/documentation
* Originally published in Novell AppNotes
Disclaimer
The origin of this information may be internal or external to Novell. While Novell makes all reasonable efforts to verify this information, Novell does not make explicit or implied claims to its validity.