Monitoring Proxy Information on Novell BorderManager
Articles and Tips: article
Senior Software Engineer
Novell Inc.
mmanisha@novell.com
Thanks to Ramanath M of Novell and Marcus Williamson of Connectotel, Ltd. for their help with this AppNote.
01 Aug 2002
The Novell BorderManager (NBM) Proxy facilitates faster and safer access to the Internet. The NBM Proxy screens help monitor the status of the Proxy and other related services on NBM. This AppNote attempts to explain some of the major Proxy screens and the information contained in them. It also discusses typical usage scenarios for some of the important fields.
- Introduction
- Proxy Cache Activity
- HTTP Proxy Statistics
- FTP Proxy Statistics
- Transparent Proxy
- ICP Statistics
- DNS Statistics
- Proxy Memory Usage and Connection Statistics
- Conclusion
|
Topics |
Novell BorderManager (NBM), TCP/IP, HTTP, FTP, DNS, ICP, proxy server, cache, network monitoring tools |
|
Products |
Novell BorderManager |
|
Audience |
network administrators |
|
Level |
intermediate |
|
Prerequisite Skills |
familiarity with Internet protocols and proxy servers |
|
Operating System |
n/a |
|
Tools |
Proxy console |
|
Sample Code |
no |
Introduction
Novell BorderManager (NBM) Proxy Services can help improve performance by locally caching frequently requested Internet information. Proxy Services store copies of frequently requested Web information closer to the user, thereby reducing the number of times the same information is accessed over an Internet connection, the download time, and the load on the remote server.
Proxy Services issue Access Controls to applications to forward and filter connections for such services as HTTP and FTP. The host running Proxy Services is known as the gateway. In general, Proxy Services allow services only for which there are proxies. For example, if a gateway has proxies for FTP, then only FTP can be requested; requests for all other services are ignored.
With gateways, you can hide the names and addresses of internal systems-the gateway is the only hostname known outside the system. Also, traffic can be logged before it reaches the internal hosts. Proxy Services improves security by hiding private network domain names and addresses and sending all requests through a single gateway.
The NBM Proxy Console provides a number of screens to monitor the status of the Proxy and other related services. This AppNote attempts to explain some of the major screens and the information contained in them. It also discusses typical usage scenarios for some of the important fields.
Note: In this AppNote, the captions for the Proxy screen shots indicate the order in which they appear on the Proxy console.
Glossary of Terms
Here is a glossary of terms you may encounter in working with the NBM Proxy.
ACL (Access Control List): An ordered list of access rules that control access to the Internet and its services.
Cache: A repositary of frequently requested information.
Cache Node: An entity that represents a cached Web object and holds the reference to the associated cache file. The cache file for a web object holds the following kinds of data: entity data, HTTP headers and meta-data. Meta-data is the persistent information about the cached data that is stored in the cache file.
Cold Node: When the data in a node is not accessed for some time, it is written to the disk drive and becomes a cold node.
DNS (Domain Name System): The method by which Internet addresses in mnemonic form (such as www.novell.com) are converted into the equivalent numeric IP address (such as 192.233.80.5). To the user and application process, this translation is a service provided either by the local host or from a remote host via the Internet. The DNS server may communicate with other Internet DNS servers if it cannot translate the address itself.
ECB (Event Control Block): A general purpose access control block used to transmit and receive events in Open Data Link interfaces.
Hot Node: When cached data is in the RAM of the server. This implies that a browser recently accessed the data. The cache file associated with a hot node is open. A hot node has more of a cached Web object's meta-data than a cold node.
ICP (Internet Cache Protocol): A UDP-based message format used for communication among proxy caches. It is used in a cache mesh to locate cached Web objects in neighboring caches. Caches exchange ICP queries and replies to select the best location from which to retrieve an object. Once the location is determined, the object is retrieved using HTTP proxy. When a query is received, the cache first checks its local cache, then sends ICP queries to its neighbors. The neighbors return ICP replies indicating a hit or miss. Depending on the replies, the proxy might access the parent neighbor to retrieve the object from the origin server. NBM is not set up to send queries through a Web hierarchy by default.
Non-Persistant Connection: A connection which is not reused for sending more than one request through the same connection.
Origin Server: The source of requested data. For example, if you enter the URL http://www.novell.com/index.html in your browser, the browser sends a request for the page named index.html to the server whose domain name is novell.com. In this case, novell.com is the origin server for the Web object index.html.
Persistant Connection: A connection in which more than one request/response can be sent/received using the same connection. The connection between the origin server and the Proxy remains active, even if there is no data flow.
Proxy Client: The component of the Proxy which talks to the origin servers for information on behalf of the Proxy users.
Proxy Server: The component of the Proxy which receives requests and sends back replies to the Proxy users.
TTL (Time to Live): When an object is retrieved from the Web and put in cache, a TTL value is associated with the object. Requests are filled from the cache for that object until the time expires. When the TTL expires, the Web server is contacted for a newer version, the update is stored in the cache, and a new TTL is calculated.
Web Object: Any Web resource hosted by a Web server.
For more information about Novell BorderManager, refer to the online documentation at http://www.novell.com/documentation/lg/bmee37/index.html.
Proxy Cache Activity
The NBM Proxy Cache Activity screens help to monitor and diagnose the Proxy Cache status. The first two screens under Proxy Cache Activity provide the following statistics: Current Cache, Proxy Connection, and Data Transfer (both from Proxy Cache to browsers and from origin servers to Proxy Cache). The last two screens provide the Lists of Origin Hosts sorted in order of data transmitted either from cache to browsers or from origin server to cache. Hence, these screens help in monitoring the current Proxy Cache health, as well as the transfer of data to browsers either directly from cache or from origin servers via the cache.
NBM FastCache Current Activity Screen
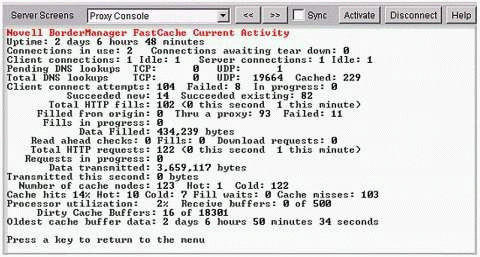
This screen (see Figure 1) shows a summary of the NBM Proxy Cache activity and the Proxy connections.
Proxy Console Screen 1: Novell BorderManager FastCache Current Activity.
Some of the important fields that help in monitoring the Proxy connection status, the Cache Activity, and the Data Transfer are described below.
Connections in use. This field shows the number of currently active connections that are set up between the browsers and the Proxy. The screen shows the number of browsers that have an established connection with the Proxy and are receiving data through these active connections.
Connections awaiting tear down. This field shows the connections that are waiting to be closed-either from the browser or due to timeout. No data is being sent through these connections.
Client connections. This field shows the number of connections currently established between the Proxy Client and origin servers. An origin server is the source of requested data.
For example, if you enter the URL "http://www.novell.com/index.html" in your browser, the browser sends a request for the page named index.html to the server whose domain name is novell.com. In this case, novell.com is the origin server for the Web object index.html. The number of connections between the Proxy server and the browsers need not be same as the number of connections between the Proxy Client and the origin servers. (For more information on Proxy Client and Proxy Server, see the "HTTP Proxy" section of this AppNote.)
Usage: If this field is not being incremented while the Server Connections field is increasing, it could mean that the network connectivity is lost between the Proxy and the Internet. It could also mean that all the browser requests are being serviced from the Proxy Cache (the browsers are hitting already-cached sites).
Idle (Client Connections). This field shows the Proxy Client connections on which there are no pending requests. No data transfer is currently going on through these connections, but these connections are still alive.
Server connections. This field shows the number of connections currently established between the browsers and the Proxy Server. This need not be same as the number of connections between the Proxy Client and the origin servers. (For more information on Proxy Client and Proxy Server, see the "HTTP Proxy" section of this AppNote.)
Usage: If this field is not getting incremented for NBM Proxy even after browser requests are made, it indicates that there is a communication problem between the NBM Proxy and the browser. This could mean that either the NBM Proxy is not configured as the Proxy server in the browser's configuration, or that there is a loss of connectivity between the browser and the Proxy.
Idle (Server Connections). This field shows the server connections on which there are no pending requests. No data transfer is currently going on through these connections, but these connections are still alive.
Client Connect Attempts. This field shows the total number of connect attempts to origin server by the Proxy Client after a successful DNS Lookup for the origin server. This field shows the total number of connect requests the Proxy Client has sent to the origin servers from the time it was loaded. This field is different from the "Client Connections" field in that it shows the cumulative Proxy Client connection statistics right from Proxy load time, while the latter gets updated only for current Proxy Client connections.
Failed. This field shows the total number of Proxy Client connect attempts to origin server that have failed since Proxy load time.
In Progress. This field shows the number of pending Proxy Client connect attempts to the origin host server.
The "Client Connect Attempts", "Failed", and "In Progress" fields help in determining the general trend of Proxy Client connect requests to the origin servers beginning from the time Proxy was loaded. If the number of failed connect attempts is high, it may imply that network connectivity to the Internet is lost.
Total HTTP Fills. This field shows the number of HTTP cache fill requests made by the HTTP Client. If the request for HTTP cache fill succeeds, the HTTP Client fills the cache with the requested URL. A request to fill the cache with a Web object is made only if there has been a cache miss in the Proxy Cache for this object. So, the "Number of cache misses" field should also get incremented accordingly.
Filled From Origin. This field shows the number of requests for filling the cache directly from the origin host. On receiving the response to these requests, the HTTP Client fills data into Proxy Cache.
Thru A Proxy. This field shows the number of cache fills with data from parent or peer Proxy (via ICP).
Fills In Progress. This is the number of cache fills by the HTTP Client currently in progress. It is equal to the number of active HTTP Client requests either to the origin host or to a neighbor Proxy (for this, the Cache Hierarchy Client should be enabled).
Usage: The Total HTTP Fills, Filled From Origin, Thru A Proxy, and Fills In Progress fields give the connection information and current data transfer activity between the HTTP Proxy and the origin servers. If your HTTP Fills are high (somewhere close to the Total HTTP Requests field of this screen), it implies that the cache misses are high.
If the Cache Hierarchy Client is enabled in NWAdmin and yet the Filled From Origin field is higher than the Thru A Proxy field, it could imply that the ICP peers/parents are failing to provide cached data via ICP. This could be due to loss of connectivity or wrong ICP configuration. To ensure that the ICP configuration on your NBM Proxy is correct, go to NWAdmin | HTTP Proxy Details | Cache Hierarchy Client. Ensure that Enable Cache Hierarchy Client is checked. Also, make sure the neighbors configured have the correct hostname, HTTP Proxy port, and ICP Port fields.
Data Filled. This field shows the total number of bytes received by HTTP Client from origin hosts. This data is filled in the Proxy Cache.
Total HTTP Requests. This field shows the total requests received by the HTTP Server from the browsers. This is a cumulative count of the number of requests from browser to HTTP Server beginning from the Proxy load time.
Requests In Progress. This field shows the number of requests to HTTP Server from browsers being processed currently.
Data Transmitted. This field shows the total bytes transferred from HTTP Server to browsers. This field shows both the header and the data transferred from HTTP Server to browsers. The requested data could be transmitted straight from the Proxy Cache or after contacting the origin server (this is done by the HTTP Client).
Transmitted This Second. This field shows the total bytes transmitted this second from the HTTP Server to browsers.
The Number of cache nodes, Hot and Cold fields are explained in the "Cache Statistics" section of this AppNote, which deals explicitly with caching. The remaining fields in this screen are:
Pending DNS Lookups (TCP/UDP). This field shows the TCP/UDP DNS queries made by the Proxy which have not got a reply from the DNS Server.
Total DNS Lookups (TCP/UDP). This field shows the total number of TCP/UDP DNS request made by the Proxy to the DNS Server.
Cached. This field shows the number of DNS replies that are cached by the Proxy.
Fills. This field shows the number of Read Ahead Misses from Cache. Since these are cache misses, they will be equal to the number of Read Ahead Cache Fills from the origin host.
Cache Hits, Hot and Cold. The Cache Hits field shows a percentage of the number of times a requested Web object is found in the cache (cache hits). The "Hot" field refers to Hot Cache Hits, which is the number of times a requested object is found in the cache as a hot node. The "Cold" field refers to Cold Cache Hits, which is the number of times a requested object is found in the cache as a cold node. (For usage notes regarding these fields, see the "Cache Statistics" section of this AppNote.)
Processor Utilization. This field shows the CPU utilization as a percentage.
Receive Buffer. This field shows the number of packets received by the Proxy, as well as the maximum number of receive buffers that have been allocated for the Proxy. In the sample screen, the maximum number of receive buffers allocated is 500. In cases where the network traffic is high, the maximum number of receive buffers can be set to a higher value. (For more information on this, see TID #10018669 at http://support.novell.com.)
Cache Statistics Screen
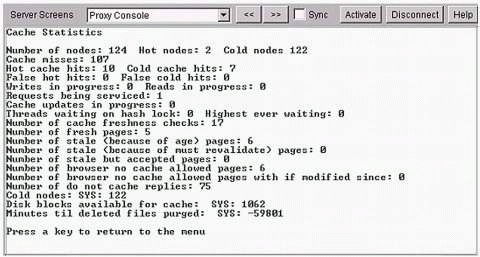
This screen (see Figure 2) shows the cache statistics for the NBM server.
Proxy Console Screen 5: Cache Statistics.
Below is an explanation of some of the more important fields on this screen.
Number of nodes. This field shows the total number of nodes (hot and cold) in the Proxy Cache. A node is an entity that represents a cached Web object and holds the reference to the associated cache file. The cache file for a Web object holds the following kinds of data: entity data, HTTP headers, and meta-data. Meta-data is the persistent information about the cached data that is stored in the cache file.
Hot nodes. This field shows the total number of hot nodes in Proxy Cache. When the node is "hot," it means that the cached data is in the RAM of the server. This implies that a browser recently accessed the data. The cache file associated with a hot node is open. Also a hot node has more of a cached Web object's meta-data than the cold node. A hot node uses more system resources to represent a cached Web object than a cold node.
Cold nodes. This field shows the total number of cold nodes in object cache. When the data in a node is not accessed for some time, it is written to the disk drive and becomes a cold node. When the data is next accessed, it is read from the disk to the RAM and becomes a hot node again. A cold node uses fewer system resources to represent a cached Web object than a hot node.
Usage: A high number of hot nodes indicates that frequent references are being made to cached Web objects. As a result of this, these cache nodes are maintained as hot nodes. On the other hand, a high number of cold nodes means that a large number of cached objects have not been accessed lately.
Cache misses. This field shows the number of requested objects that were not found in cache (as either a hot node or a cold node). A cache miss results in the object being brought into the cache as a hot node. It also means that the Proxy Client contacts the origin server for the requested object.
Hot cache hits. This field shows the count of how many times an object requested for is found in the cache as a hot node.
Cold cache hits. This field shows the count of how many times an object requested for is found in the cache as a cold node.
Usage: A high number of hot cache hits means that frequent requests are being made to the same cached Web objects. A cold cache hit implies that though the request resulted in a cache hit, the cached object had not been referenced for some time. As a result of this, the cold node will first have to be made a hot node. More memory has to be allocated for a hot node before returning the cached object to the requestor. (For more information on hot and cold nodes, refer to the explanation of the "Hot Nodes" and "Cold Nodes" fields above.)
Writes in progress. This field shows the count of the number of cache writes being done currently. The write could be for the creation of a new object in the cache (a new cache entry being created) after a request from a browser resulted in a cache miss. Or the write could be for an update to an existing cache object since the cache object has become stale. Cached data becomes stale when it is no longer same as the Web object in the origin server.
Reads in progress. This field shows the number of current cache reads.
Requests being serviced. This field shows the number of browser requests currently being serviced by the cache.
Cache updates in progress. This field shows the number of cache objects being updated currently. Update of cached objects could be due to expiration of TTL (Time To Live) of the cached object. The freshness of a cached object is determined by the time for which the data is consistent with the data available on the origin server. This time frame is called TTL of the cached data object.
Threads waiting on hash lock. This field shows the number of threads waiting on a lock for accessing a cache object. This field shows the number of requests from browsers that are trying to get the same cached Web object.
Number of cache freshness checks. This field shows the number of times checks are made for freshness of a hot node. Freshness of a hot node is checked every time a request for a cache object is made (provided the hot node has not just been created). If the hot node turns out to be stale, an update is made to the cached object before satisfying the request for this object.
Number of browser no cache allowed pages. This field shows the number of browser requests that specify the data should be reloaded from origin server instead of the cache. So, the cache entry for the object is discarded. The next request for the same data will result in a cache miss.
Number of browser no cache allowed pages with if modified since. This field shows the number of browser requests that specify that the data should be reloaded from origin server if the object requested for was modified. So, the cache entry for the object is modified.
Number of do not cache replies. This field shows the number of replies (from origin server to HTTP Client) for which caching of content will not be done.
Usage: A typical scenario would be that the browser makes a request that either results in a cache miss or in the cached data being stale. The Proxy Client sends a request for the object to the origin server and the origin server sends a reply with the "do not cache" flag set. The Proxy sends the reply to the browser without caching the reply.
Disk blocks available for cache. This field shows the number of disk blocks that are currently available for the data cached by NBM Proxy. A cached Web object is written to the disk when it is not accessed frequently (the node corresponding to this Web object becomes cold). If no more disk blocks are available, the least used data on the disk is removed. The Proxy maintains the disk space internally.
Hosts Sorted by Data Transmitted from Cache Screen
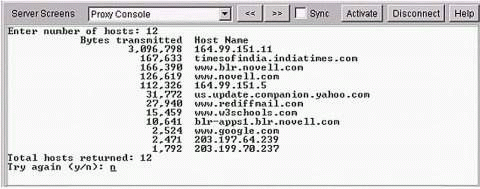
This screen (see Figure 3) lists origin hosts in descending order of the amount of data transmitted from the cache.
Proxy Console Screen 14: Hosts sorted by data transmitted from cache.
This screen shows a list of origin hosts in order of cache bytes transmitted on behalf of the origin hosts. It takes the number of hosts to be sorted as input, and displays hosts and bytes transmitted from cache for each host in decreasing order of data transferred. The number of DNS cache entries in the NBM Proxy limits the maximum number of hosts that can be listed on this screen. If the number of hosts to be sorted (given as an input to this screen) is greater that the actual entries in the DNS cache, you may see information about fewer hosts than you requested.
Hosts Sorted by Data Received by Cache Screen
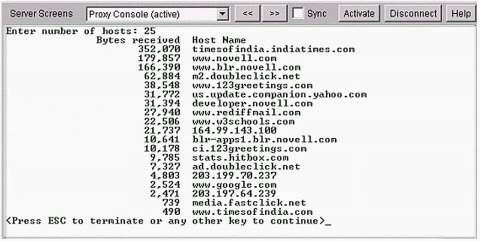
This screen (see Figure 4) lists origin hosts in descending order of the amount of data received by the cache.
Proxy Console Screen 15: Hosts sorted by data received by cache.
This screen shows a list of origin hosts sorted in decreasing order of most bytes received by the cache from origin server. It takes the number of hosts to be sorted as input, and displays hosts and bytes received by cache for each host in decreasing order of data received. The number of DNS cache entries in the NBM Proxy limits the maximum number of hosts that can be listed on this screen. If the number of hosts to be sorted (given as an input to this screen) is greater that the actual entries in the DNS cache, you may see information about fewer hosts than you requested.
Usage: You can use the above two screens to monitor Internet usage on your network. These screens give a listing of sites in order of data transferred to browsers (either from cache or origin servers). You can use this information to see from which sites the browsers are getting the most data. One example would be to use this information as an input to the "batch download" feature, which would help save time for your users. For instance, if you find that the highest data transfer is from www.novell.com, you could plan to download the data from this site before office hours every day, or once a week. This would then reduce access time for users who want to access the site's data during office hours.
HTTP Proxy Statistics
The HTTP Proxy Statistics screens help you monitor the NBM HTTP Proxy activity. The two screens described below show the statistics for the HTTP Server and the HTTP Client. The HTTP Server listens for browser requests and sends replies to the browsers. The HTTP Client, on the other hand, sends requests to the origin servers. The Proxy Cache provides the communication between the two components.
When a request for a Web object arrives from a browser, the HTTP Server asks the Proxy Cache for the object. If the object is present in the cache, the HTTP Server is called which sends the cached object back to the browser. If the requested object is not present in the cache (or is stale), the cache invokes the HTTP Client which forms and sends a request to the origin server. These screens also show a brief summary of the Proxy Cache (for both HTTP and FTP Proxies).
HTTP Server Statistics Screen
This screen (see Figure 5) shows a summary of HTTP Server statistics and cache statistics for both HTTP Server and FTP Server.
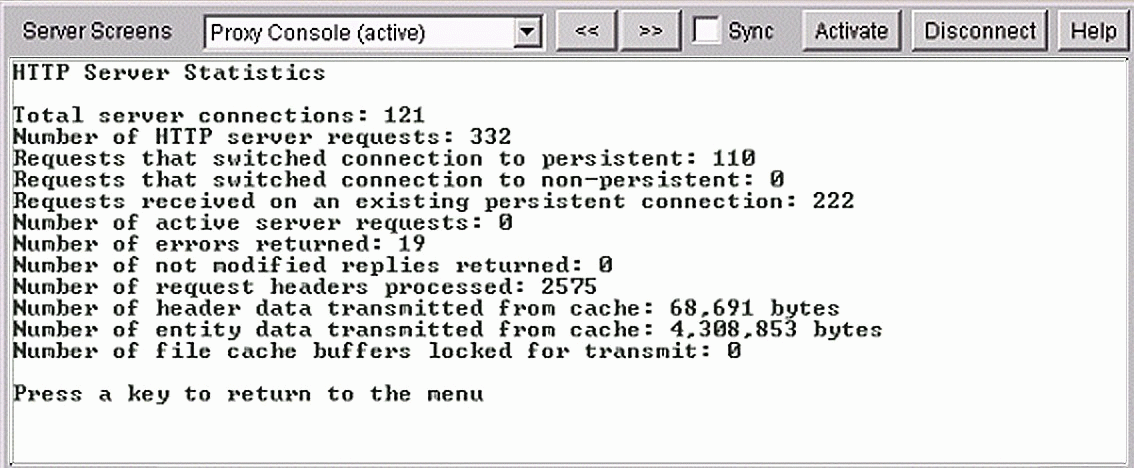
Screen 7 on the Proxy console: HTTP Server Statistics.
Below are explanations of some of the more important fields in this screen.
Total server connections. This field shows the total number of connections established between the browsers and the Proxy Server. This is different from the Server Connections field of the FastCache Activity screen. This field refers to the total number of connections made between the browsers and the Proxy server from Proxy load time, while the other field shows the current (active) connections.
Usage: If this field is not getting incremented for NBM Proxy even when browser requests are made, it indicates that there is a communication problem between the Proxy and the browser.
Number of HTTP server requests. This field shows the total number of requests received by the HTTP Server from the browsers. At a given point in time there can be more than one request to the HTTP Server from a single browser connection. Therefore, the number shown in this field will be usually higher than the total number of server connections.
Requests that switched connection to persistent. This field shows the number of connections that have been changed to become persistent. A persistent connection is where more than one request/response can be sent/received using the same connection. For example, suppose a browser sends a request to a host such as www.cnn.com and the response is received. If the connection is persistent, it would not be terminated after this response arrives. The connection between the origin server and the Proxy would remain active, even if there is no data flow. In fact, it will be reused for requests from other hosts.
Requests that switched connection to non-persistent. This field shows the number of connections that have been changed to non-persistent. In a non-persistent connection, the connection does not get reused for sending more than one request through the same connection.
Number of active server requests. This field shows the number of requests to HTTP Proxy/FTP Proxy being processed currently. The field shows the current activity of the Proxy server. If the field remains zero for quite some time, it means the Proxy server is not receiving any requests from the browsers. This could be due to wrong configuration of the browser's Proxy or to loss of connectivity.
Number of errors returned. This field shows the number of times an HTTP error is returned to the browsers by the HTTP Server. Some of the reasons for HTTP Server error could be a bad request from the browser, authentication failure, internal server error, forbidden site (this could be stored in the Proxy cache or DNS cache), or failure to connect to neighbor Proxy (if the Proxy is configured to forward only through ICP).
Number of not modified replies returned. This field shows the number of times the Proxy received "Not modified" replies as a response to Proxy's "conditional GET" request. A Proxy may send a "conditional GET" request to the origin servers where it can tell the origin server to resend the data to the Proxy if the data was modified since the last time it was accessed by the Proxy. If the data is not modified, the origin host replies with a "Not modified" reply, indicating that the data held by the Proxy is still valid.
Number of header data transmitted from cache. This field shows the header data transmitted from Proxy cache to browsers in bytes.
Number of entity data transmitted from cache. This field shows the entity data transmitted from Proxy cache to browsers in bytes. (For more details on Proxy Cache, see the "Proxy Cache Activity" section of this AppNote.)
HTTP Client Statistics Screen
This screen (see Figure 6) shows a summary of HTTP Client statistics.
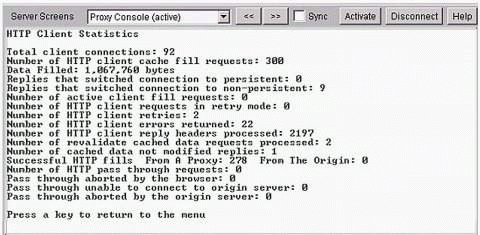
Proxy Console Screen 8: HTTP Client Statistics.
Below are descriptions of the more important fields on this screen.
Total client connections. This field shows the total number of connections established between the Proxy Client and the origin servers. This is different from the Client Connections field of the FastCache Activity screen in that this field refers to the total number of connections made between the Proxy Client and the origin server for Proxy up-time. The other field shows the current (active) connections.
Number of HTTP client cache fill requests. This field shows the number of HTTP cache fill requests made by the HTTP Client. The HTTP Client will make a cache fill request only when it does not find a requested Web object in the cache (cache miss), or the object is cached but is stale. If the request to the origin server succeeds, HTTP Client fills the cache with the requested Web object. This field increments every time the cache miss field increments.
Data Filled. This field shows the total number of bytes received by HTTP Client from Origin hosts. This data is filled in the cache.
Replies that switched connection to persistent. This field shows the number of HTTP replies from origin server to Proxy that want the connection to be maintained as a persistent connection.
Replies that switched connection to non-persistent. This field shows the number of HTTP replies from origin server to Proxy that want the connection to be maintained as a non-persistent connection. (For more information on persistent and non-persistent connections, see the "HTTP Server Statistics" section of this AppNote.)
Number of active client fill requests. This field shows the number of cache fills by HTTP Client currently in progress. Since a client fill can occur only after the Proxy Client makes a request for a Web object, this field is equal to the number of active client requests either to the origin host or to a neighbor Proxy (if Cache Hierarchy Client is enabled).
Number of HTTP client requests in retry mode. This field shows the number of active retry requests sent by the HTTP Client to the origin server. A request sent from the HTTP Client is in retry mode after the initial request(s) return HTTP errors.
Number of HTTP client retries. This field shows the total number of retry requests sent by HTTP Client to origin hosts. The previous field refers only to the active HTTP Client retry requests, while this field shows the total number of retry requests that the Proxy sent to the origin servers during entire Proxy up-time.
Number of HTTP client errors returned. This field shows the total number of errors returned by the HTTP Client due to connection error, or bad reply from origin host, or Proxy cache error, or failure to connect to a neighbor Proxy (if ICP is configured).
Number of HTTP client reply headers processed. This field shows the number of HTTP reply headers received from the origin server and processed by the HTTP Client.
Number of revalidate cached data requests processed. This field shows the number of requests made by HTTP Client to origin host for validating if an existing cache object is modified since the last modified time stored in the cache.
Number of cached data not modified replies. This field shows the number of replies from origin host to HTTP Client indicating that an existing cached object is not modified since a specified date. The HTTP Client may send a "conditional GET" request to the origin servers where it can tell the origin server to resend the data to the Proxy if the data was modified since the last time it was accessed by the Proxy. If the data is not modified, the origin host replies with a "Not modified" reply indicating that the data held by the Proxy is still valid. This field refers to the number of such replies from the origin servers.
Successful HTTP fills - From A Proxy. This field shows the cache fill by data from a parent or a peer Proxy set up as an ICP neighbor of this Proxy. This field increments if Client Hierarchy is enabled and configured through NWAdmin. In case this field is not incremented, it may imply that the ICP configuration is incorrect, or that connectivity to parent or peer proxies has been lost.
From The Origin. This field shows the number of requests made for filling the cache by data directly from origin server. The HTTP Client fills data into cache directly after sending requests to origin hosts. (For more information on ICP, see the "ICP Statistics" section of this AppNote.)
FTP Proxy Statistics
The FTP Proxy Statistics screen helps you monitor both Forward FTP Proxy and Reverse FTP Proxy (FTP Accelerator) statistics. The Forward FTP Proxy helps in controlling access to FTP sites. It can also be used to cache FTP data for anonymous users, thus enabling faster downloads. The Reverse FTP Proxy helps in accelerating FTP transfers from the Internet or intranet to the local FTP server. You can use the statistics screen described in this section to monitor the behavior of Forward and Reverse FTP Proxy.
FTP Proxy and Accelerator Statistics Screen
This screen (see Figure 7) shows both Forward FTP Proxy and Reverse FTP Proxy (Accelerator) statistics.
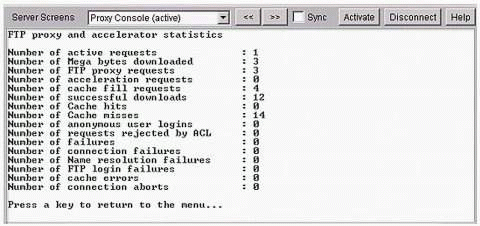
Proxy Console Screen 19 > 2: FTP Proxy and Accelerator Statistics.
Below are explanations of some of the more important fields in this screen.
Number of active requests. This field shows the number of requests to Forward FTP Proxy and/or Reverse FTP Proxy that are being currently processed. For a Forward FTP Proxy, these are FTP requests that are sent from the intranet to an FTP site on the Internet. For a Reverse FTP Proxy, these are requests coming to the FTP server that the Proxy is accelerating.
Number of FTP proxy requests. This field shows the number of requests made by the Forward FTP Proxy to the origin FTP Server.
Number of acceleration requests. This field shows the number of requests made by the FTP Accelerator to the FTP server that the FTP Accelerator is accelerating.
Number of cache fill requests. This field shows the number of requests made to the Proxy Cache for caching an FTP object. The FTP data is cached only for anonymous users for faster downloads.
Number of successful downloads. This field shows the number of times a requested data transfer goes through successfully either from Proxy Cache to the FTP client (in case of a cache hit) or directly from origin FTP server to the FTP client (in case of a cache miss).
Number of Cache hits. This field shows the number of times a requested data transfer is carried out from cache. In case of Forward FTP Proxy, the Proxy cache is contacted only for anonymous users. For the rest of the users, the requests are satisfied by directly contacting the origin FTP server.
Number of Cache misses. This field shows the number of times the origin FTP server is contacted for a data transfer since the object requested for is not present in the cache or the data is present in the cache but is stale.
Number of anonymous user logins. This field shows the number of anonymous users that have logged in to the origin FTP servers. There are two logins when a FTP client tries to request for FTP data through an NBM FTP Proxy. An example of a user login would be:
xxx.novell$anonymous$ftp.novell.com
where xxx.novell is the fully distinguished name of the user in eDirectory (required only if Proxy authentication is enabled as clear text in NWAdmin), anonymous is the FTP username (username at ftp.novell.com), and ftp.novell.com is the FTP hostname.
This field shows the total anonymous logins made to the origin FTP host (ftp.novell.com in this example).
Number of requests rejected by ACL. This field shows the number of FTP data transfers rejected by the FTP Proxy because of a corresponding deny Access Control Rule in the Access Control List (ACL) of the NBM server. An ACL is an ordered list of access rules that control access to the Internet and its services. As an example, the NBM Server may have an Access Control Rule in its ACL that says: "Deny host 164.99.146.5 access to the ftp.novell.com site." In such a case, this field will increment if client 164.99.146.5 requests a FTP data transfer from this site.
Number of FTP login failures. This field shows the number of login failures to the FTP Proxy server (this would apply only if authentication is enabled on the FTP Proxy server). This field only shows the total number of login failures to the FTP Proxy; it does not include login failure to the origin FTP server. So if the first field of the username/password command (xxx.novell username in the example) is incorrect, this field will increment.
Number of connection failures. This field shows the number of FTP failures due to TCP connection failure.
Number of Name resolution failures. This field shows the number of FTP failures due to error in DNS Lookup for the origin FTP server.
Number of cache errors. This field shows the number of errors while writing FTP header or entity data to cache.
Number of connection aborts. The field shows the number of connections aborted during FTP data transfers from origin FTP server to Proxy cache.
Transparent Proxy
The HTTP Transparent Proxy enables you to use an NBM server as the HTTP Proxy Server without having to specifically configure each user's browser to point to the Proxy Server. This feature can be used if each browser need not be reconfigured to point to the Proxy Server. It also helps in enforcing network security by ensuring that all HTTP requests pass through the Proxy. The screen described in this section helps you monitor Transparent Proxy activity.
Transparent Proxy Statistics Screen
This screen (see Figure 8) shows the Transparent Proxy statistics. It is updated only if the NBM Proxy is configured as a Transparent Proxy through NWAdmin.

Proxy Console Screen 20: Transparent Proxy Statistics.
Below are explanations of the fields in this screen.
Local IP addresses. This field shows a list of all local IP addresses within the network for which one can choose to disable redirection. This can be done to ensure that HTTP packets coming from these IP addresses will not be redirected to the NBM HTTP Proxy. This is the list of IP addresses that have been added as Exception IP Addresses while configuring the Proxy as an HTTP transparent Proxy in NWAdmin.
Number of Transparent Proxy requests received. This field shows the total number of HTTP requests received by the Transparent Proxy from the browsers since Proxy load time.
Number of Active Transparent Proxy requests received. This field shows the number of HTTP requests currently being processed by the Transparent Proxy.
Usage: If the above two fields are not getting updated even after the HTTP Proxy is configured as Transparent, check to see if IP Forwarding is enabled on the NBM server (check this in INETCFG.NLM). If IP Forwarding is enabled on the Proxy Server and the Transparent Proxy configuration is correct, ensure that the client machines are using the Proxy's private IP address as the TCP/IP gateway address.
ICP Statistics
The screen described in this section helps you monitor Internet Cache Protocol (ICP) activity. The screen is updated only if the Proxy Server is configured as a Cache Hierarchy Client in NWAdmin. This is valid for all fields except "Total Cache Fill Requests" and "Fill From Origin." These two fields get updated even if ICP is not configured.
ICP Statistics Screen
This screen (see Figure 9) shows ICP statistics.
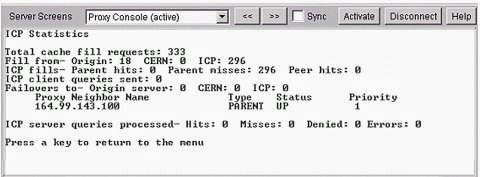
Proxy Console Screen 3: ICP Statistics.
Below are explanations of the fields in this screen.
Total cache fill requests. This field shows the number of times data (HTTP or FTP) is filled into Proxy Cache after a cache miss or if the cached object is found to be stale. This field gets incremented if data filled in the cache is either received from a neighbor Proxy (through ICP) or directly from the origin server.
Fill from - Origin / CERN / ICP. The "Origin" portion of this field shows the number of times HTTP or FTP data is received directly from the origin server and not from cache (which gets updated even if ICP is not configured since this data is not related to ICP). The "CERN" portion shows the number of times HTTP or FTP data is fetched from the most preferred CERN Proxy. The "ICP" portion shows the number of times HTTP or FTP data is fetched from a neighbor (parent or peer) Proxy (through ICP). The object requested can be received from parent cache or peer cache, or it can be fetched by the parent from its neighbor (using ICP) or from the origin server.
ICP fills - Parent hits / Parent misses / Peer hits. The "Parent hits" field shows the number of times an object requested by this Proxy to the parent Proxy (using ICP) is found in the parent's cache.
The "Parent misses" field shows shows the number of times an object requested by this Proxy to the parent Proxy (using ICP) is not found in the parent's cache. Parent misses will result in data fetches from the origin server by the parent Proxy.
The "Peer hits" field shows the number of times an object requested by this Proxy to the peer Proxy (using ICP) is found in the peer's cache.
ICP client queries sent. This field shows the number of queries sent by the ICP client (if Cache Hierarchy Client is enabled on the Proxy Server) to a configured parent or peer configured as an ICP Server.
Failovers to - Origin server / CERN / ICP. The "Origin server" field shows the number of times HTTP Client fetches data from origin server after failing to get data using ICP. Failure of ICP can be due to requested data not being present in any of the parent caches, or if the cache hierarchy configuration is changed while retries are made to get data from parent or peer proxies. If this field has a high value, check to see if the ICP configuration is correct.
The "CERN" field shows the number of times the HTTP Client contacts a CERN neighbor for data after connection to a Proxy parent has failed.
The "ICP" field shows the number of times the HTTP Client contacts an ICP neighbor for data after connection to a Proxy parent has failed.
Usage: These fields are incremented if the HTTP Client's connection with an ICP neighbor fails and the Proxy needs to find an alternate host (either another neighbor Proxy or the origin server) to which the HTTP request can be sent.
ICP server queries processed - Hits / Misses. The "Hits" field shows the number of times ICP Server finds data requested by ICP requestor either in its cache or in ICP hierarchy (from peer or parent Proxy). The "Misses" field shows the number of times ICP Server cannot find data requested by ICP requestor either in its cache or in ICP hierarchy (from peer or parent Proxy).
Usage: These two fields are updated only if the Proxy server is configured as an ICP Server.
DNS Statistics
The Domain Name System (DNS) screens help you monitor the DNS Lookup activity of the NBM Proxy. The three screens described in this section give a summary of the DNS Lookup statistics, the detailed information about a host as is stored in the DNS cache, and a listing of hostnames sorted in decreasing order of DNS lookups performed. You can use these screens to obtain the following, along with other useful information:
The number of times a host is being hit by browsers
The state of a host entry in the DNS cache
The current status of the DNS cache
DNS Statistics Screen
This screen (see Figure 10) shows DNS statistics. Depending on whether DNS is using UDP or TCP (which is mentioned in the title of the screen), some fields on this screen may get updated, while others may not.
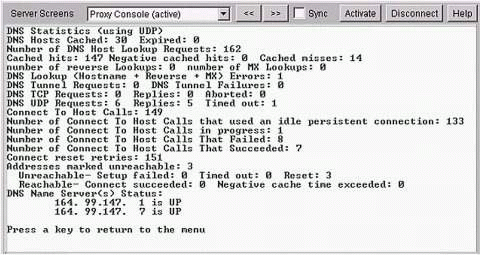
Proxy Console Screen 4: DNS Statistics.
Below are explanations of the fields in this screen.
DNS Hosts Cached. This field shows the number of hosts that have a DNS cache entry in the Proxy.
Expired. This field shows the number of DNS cache entries that have become stale. A stale DNS cached entry will be included in the expired count only if a lookup is done for this particular host.
Cached Hits. This field shows the number of times an entry for a host is found in the DNS cache. In case of a cache hit, the Proxy gets the DNS information directly from the cache and the number of references to the cached DNS entry for this host also gets incremented.
Negative Cached Hits. This field shows the number of hits to the unsuccessful DNS lookup results. A DNS query can result in either successfully finding the DNS node or an unsuccessful look up. The Proxy caches both successful and unsuccessful DNS lookup results.
Cached Misses. This field shows the number of times a DNS entry for a host is not found in the DNS cache. A DNS cache miss results in a query to a name server to resolve the host name. Once the response to this query is obtained the corresponding host entry is added to the DNS cache.
DNS Tunnel Requests. This field shows the number of lookup requests directly sent to the name server bypassing the DNS cache. These requests form another path directly to the DNS server instead of going through the DNS cache.
DNS Tunnel Failures. This field shows the number of direct lookup requests to name server (bypassing the DNS cache) that were unsuccessful.
Connect To Host Calls. This field shows the number of TCP connects to the origin hosts. A connection is made to an origin host only when the DNS lookup was successful and the DNS entry for the host is present in the DNS cache before a request for connect to the origin server is made. So if the connection has been successfully established between the Proxy and the origin server (this field increments), there should either be an increase in the DNS Cached Hits, or both the Cached Misses and the DNS Hosts Cached should increment.
Connect Reset Retries. This field shows the number of connection retries to the origin host by the Proxy after TCP connection is refused by the origin server.
Addresses Marked Unreachable. This field shows the number of addresses stored in DNS Cache that were marked unreachable by the Proxy. An address in the DNS Cache could be marked unreachable due to any of the following reasons: a connection reset sent by the origin server, a connection time-out, or a failure during connection initialization (setup).
DNS Name Server(s) Status. This field shows the addresses and status of all configured DNS Name Servers.
DNS TCP/UDP Requests. This field shows the total number of TCP/UDP requests for DNS Lookups. It includes both tunneled requests sent directly to the name server and requests for which the DNS cache is contacted before sending a request to the name server.
DNS TCP/UDP Replies. This field shows the total number of TCP/UDP replies sent by the name server to the Proxy in response to a DNS query.
Aborted. This field shows the number of aborted TCP Connections between the Proxy and the name server. After a TCP connection is aborted, the Proxy tries to establish a connection with the name server again and resends the DNS query.
Time Outs. This field shows the total number of UDP requests that timed out before a reply was received from the name server.
Usage: For the above fields, either the TCP or the UDP fields get incremented depending on whether DNS is configured to use TCP or UDP (see the title of the screen to find this out).
DNS Cache Entry Information Screen
This screen (see Figure 11) shows information stored in the DNS cache entry for a host.

Proxy Console Screen 14: DNS cache entry information.
Below are explanations of the fields on this screen.
Name. This field shows the name of the host whose DNS cache information is displayed on the screen.
State. This field shows the cache entry state of the host. It can be one of the following: Cached Entry, Negative Cached Entry, or DNS Resolution In Progress.
Type. This field shows how the DNS resolution of this host was done before caching the entry.
Usage: The host entry can be in either the SYS:/ETC/HOSTS or SYS:/ETC/PROXY/PXYHOSTS file on the server, or it can be resolved through a DNS Name Server. If the host entry is found in one of the above two files, then the DNS cache is updated to reflect the same and the type of the cache entry is maintained. Any change in either or both of these files is reflected to the DNS cache.
Time Created. This field shows the time of creation of the cache entry for this host.
TTL In Seconds. This field shows the Time To Live-the amount of time in seconds for which the DNS Cache entry for this host will be valid.
Number Of Lookups. This field shows the number of times this host has been looked up (while it was in cache).
Cache Bytes Transmitted. This field shows the total number of bytes transmitted from the origin host to HTTP or FTP Proxy. Every time transfer of data is done from an origin host that has its DNS entry in the DNS cache, this field gets incremented by the number of bytes transmitted.
Bytes Physically Received From This Host. This field shows the total number of bytes transmitted from the host. These bytes could have either originated from this host (this host is the origin server) or have been transmitted from the ICP cache of this host (this host is configured as the ICP neighbor of our Proxy).
Bytes Received Originating At This Host. This field shows the total number of bytes transmitted from the host that have originated from this host (this host is an origin server for our Proxy).
Usage: This screen also displays the IP address(es) for the host. For each address, port(s), number of requests made to each port, and the status of each connection are also displayed (provided the Type of the DNS cache entry is "Resolved through a DNS Name Server").
Hosts Sorted by Most DNS Lookup Requests Screen
This screen (see Figure 12) shows a list of origin hosts sorted in decreasing order of number of lookup requests made to the origin hosts.
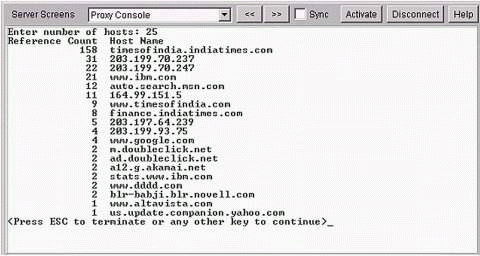
Proxy Console Screen 13: Hosts sorted by most DNS lookup requests.
The screen takes the number of hosts to be sorted as input and displays the hosts and the number of lookup references made for each host. The number of DNS cache entries in the NBM Proxy limits the maximum number of hosts that can be listed on this screen. If the number of hosts to be sorted (given as an input to this screen) is greater that the actual entries in the DNS cache, you may see information about fewer hosts than you requested.
Usage: You can use the data in this screen to draw inferences about the Internet usage on the network. For example, if the usage is high during a particular week, you can refer to this screen to see which sites were accessed the most. This information can also be used in tracking unwanted browsing in the workplace that should be reduced. For example, if the site playboy.com appears in this list, it would indicate unwanted usage. This screen can also show how often such sites are being hit from the network.
Proxy Memory Usage and Connection Statistics
The Proxy memory usage and connection statistics screens help you track the system resources that NBM is allocated. The two screens described in this section show a breakdown of the memory and connections used by the various components of the Proxy. In scenarios where there is a high usage of system resources by the NBM Proxy, this can help you determine which component of the Proxy is causing the high usage.
Proxy Memory Usage Statistics Screen
This screen (see Figure 13) shows total memory usage and a breakdown of the memory usage.
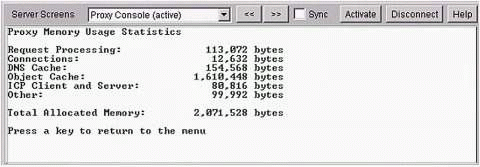
Proxy Console Screen 2: Proxy Memory Usage Statistics.
Below are explanations of the fields in this screen.
Request Processing. This field shows the total memory (in bytes) allocated for request blocks of the NBM Proxy.
Connections. This field shows the total memory (in bytes) allocated for connection blocks of the NBM Proxy.
DNS Cache. This field shows the total memory (in bytes) allocated for DNS Cache.
Object Cache. This field shows the total memory (in bytes) allocated for Proxy Object Cache.
ICP Client and Server. This field shows the total memory (in bytes) allocated for ICP Client and ICP Server. This field will not be incremented if the Proxy server is not configured either as an ICP Client or as an ICP Server.
Other. This field shows the total memory (in bytes) allocation for other Proxy activities like logging, debug messages, console messages, local data allocation, and fast memory.
Total Allocated Memory. This field shows the total memory (in bytes) allocated for the Proxy. This is a sum of all the above memory allocations.
Connection Statistics Screen
This screen (see Figure 14) shows connection statistics for the NBM Proxy.
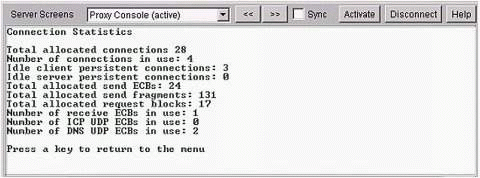
Screen 9 on the Proxy console: Connection Statistics.
Below are explanations of the fields on this screen.
Total allocated connections. This field shows the total number of connection blocks allocated currently for the Proxy.
Number of connections in use. This field shows the number of connections blocks currently being used by the Proxy (both on Proxy Server and Proxy Client).
Idle client persistent connections. This field shows the total number of Proxy Client persistent connections that are currently idle.
Idle server persistent connections. This field shows the total number of server persistent connections that are currently idle.
For more information on persistent and non-persistent connections, see the "HTTP Server Statistics" section of this AppNote.
Total allocated send ECBs. This field shows the number of Event Control Block (ECB) allocated to the Proxy for sending data.
Total allocated send fragments. This field shows the number of send fragments allocated to the Proxy. Packets are divided into fragments when they exceed the minimum transmission unit (MTU) size.
Total allocated request blocks. This field shows the number of request blocks currently allocated for the Proxy.
Number of receive ECBs in use. This field shows the number of receive buffers allocated by Proxy that are currently in use.
Number of ICP UDP ECBs in use. This field shows the number of UDP ECBs that are currently being sent out by the ICP server to reply to an ICP requestor.
Number of DNS UDP ECBs in use. This field shows the number of UDP ECBs that are currently being sent out by the Proxy Client as a DNS query to a DNS Name Server.
Conclusion
This AppNote has attempted to explain some of the major Proxy screens and the information contained in them. The facts and figures provided herein are strictly from test scenarios; there can be deviations from these figures in real-world scenarios. Novell recommends that you verify the field information on a simulated test network before you use them to get results directly in a production environment.
* Originally published in Novell AppNotes
Disclaimer
The origin of this information may be internal or external to Novell. While Novell makes all reasonable efforts to verify this information, Novell does not make explicit or implied claims to its validity.