Understanding Novell BorderManager's HTTP Proxy Logs
Articles and Tips: article
Connectotel Ltd.
marcus.williamson@myrealbox.com
http://www.connectotel.com/
01 Jan 2002
This AppNote discusses the HTTP Proxy Server log files that are generated by Novell BorderManager to track Internet usage. It tells how to enable and configure the three types of log files: Common, Extended, and Indexed. It also describes the contents of the log files and introduces some third-party tools to help in analysing these files.
Because this AppNote was written in the U.K., it retains the British spelling used by the author.
- Introduction
- Common Log Files
- Extended Log Files
- Indexed Log Files
- Using WebTrends Firewall Suite
- Conclusion
|
Topics |
BorderManager log files, network management |
|
Products |
Novell BorderManager |
|
Audience |
network administrators, technical support personnel |
|
Level |
intermediate |
|
Prerequisite Skills |
familiarity with basic BorderManager operation |
|
Operating System |
n/a |
|
Tools |
Active LogView, BRDSTATS, WebTrends for Firewalls and VPNs |
|
Sample Code |
no |
Introduction
The ability to create accurate log files is an important aspect of the operation of proxy software. Log files provide the following functionality for administrators and users of the proxy:
Determine patterns of bandwidth utilisation
Identify attempts to access undesirable Internet resources
Monitor usage of the Internet by site and/or by authenticated user
Troubleshoot issues with packet filtering or rules
The Novell BorderManager HTTP Proxy maintains three types of log files:
Common Log
Extended Log
Indexed Log
In general, the common log format provides sufficient information for analysis of outgoing proxy activity. In some circumstances, such as when using specialised log analysers, it may be appropriate to use the extended or indexed log formats
This AppNote describes these logs, telling how each one can be enabled and configured and what information can be obtained from each of them. Also discussed is the use of WebTrends Firewall Suite, a popular analysis tool which can be used to report on the contents of the BorderManager Common Log file.
Common Log Files
The BorderManager HTTP Proxy Common Log is a text file which contains information about each request sent via the proxy by proxy users.
Enabling the Common Log
The Common Log is enabled by checking the "Common" Logging Format option on the "Logging" tab of the Application Proxy configuration screen, as shown in Figure 1. This dialog box is reached in the NetWare Administrator (NWAdmin) utility via the BorderManager Setup tab from the BorderManager server object.
Configuring the parameters for the Common Log file.

Configuration Parameters for Common Log Files
Additional configuration information may be provided at this point, as described below.
Location of the Common Log Files. By default, the BorderManager Common Log files are stored in the following directory:
volumename:\ETC\PROXY\LOG\HTTP\COMMON
This can be changed to another location, if desired. It is recommended that a volume other than SYS be used for storing the Common Logs.
Controlling the File Size. Depending on the Log Rollover option chosen, there will either be one file per day (Rollover By Time), or a series of files named by date of creation (Rollover By Size). To change the rollover configuration, select the desired option in the screen shown in Figure 1 above.
The amount of disk space consumed by the files can be controlled by the "Old Log Files" options.
Contents of the Common Log File
Information in the Common Log file is stored in the following format:
|
Field
|
|
|
IP Address |
The private IP address used by the client accessing the BorderManager server (for example, 10.1.1.2) |
|
Authenticated User Name |
The name of the user accessing the BorderManager server including the user's common name (CN) and full context (for example, .admin.acme). This will only be present if authentication using the Single Sign-On (SSO) method (CLNTRUST.EXE) or Secure Socket Layer (SSL) method is being used. For information on configuring SSO and SSL, see the BorderManager documentation and README file. |
|
Date |
The date on which the request was made (for example, 03/Dec/2001) |
|
Time |
The time of day at which the request was made (for example, 12:07:41) |
|
Time Zone |
The time zone on the server at which the request was made, as an offset from Greenwich Mean Time (for example, +0000) |
|
HTTP Request |
HTTP requests commonly seen in logs are: ET (read a page or entity within a page)EAD (obtain the header information for a page)OST (submit the results of a form) |
|
URL |
The URL of the site being accessed, including the domain name and the full path within the site (for example, http://support.novell.com/images/ support_nav_bar.gif) |
|
HTTP Version |
The version of HTTP used by the requesting entity this will always be "HTTP/1.0") |
|
Status Code |
A number which indicates whether or not the request made by the client via the proxy has been successful. code of "200" indicates success. Other codes provide informational or error status information. The possible status codes and their meanings are listed in the next table. |
|
File Size |
The size of the log file in bytes (for example, 3264) |
This table lists the HTTP status codes and their meanings. Note that more status codes are recognised in the HTTP 1.1 standard.
|
Status Code
|
HTTP Version
|
Meaning
|
|
100 |
1.1 |
Continue |
|
101 |
1.1 |
Switching Protocols |
|
200 |
1.0, 1.1 |
OK |
|
201 |
1.0, 1.1 |
Created |
|
202 |
1.0, 1.1 |
Accepted |
|
203 |
1.1 |
Non-Authoritative Information |
|
204 |
1.1 |
No Content |
|
205 |
1.1 |
Reset Content |
|
206 |
1.1 |
Partial Content |
|
300 |
1.1 |
Multiple Choices |
|
301 |
1.0, 1.1 |
Moved Permanently |
|
302 |
1.0.1 |
Moved Temporarily ound |
|
303 |
1.1 |
See Other |
|
304 |
1.0, 1.1 |
Not Modified |
|
305 |
1.1 |
Use Proxy |
|
307 |
1.1 |
Unused |
|
308 |
1.1 |
Temporary Redirect |
|
400 |
1.0, 1.1 |
Bad Request |
|
401 |
1.0, 1.1 |
Unauthorized |
|
402 |
1.1 |
Payment Required |
|
403 |
1.0, 1.1 |
Forbidden |
|
404 |
1.0, 1.1 |
Not Found |
|
405 |
1.1 |
Method Not Allowed |
|
406 |
1.1 |
Not Acceptable |
|
407 |
1.1 |
Proxy Authentication Required |
|
408 |
1.1 |
Request Timeout |
|
409 |
1.1 |
Conflict |
|
410 |
1.1 |
Gone |
|
411 |
1.1 |
Length Required |
|
412 |
1.1 |
Precondition Failed |
|
413 |
1.1 |
Request Entity Too Long |
|
414 |
1.1 |
Request-URI Too Long |
|
415 |
1.1 |
Unsupported Media Type |
|
416 |
1.1 |
Requested Range Not Satisfiable |
|
417 |
1.1 |
Expectation Failed |
|
500 |
1.0, 1.1 |
Internal Server Error |
|
501 |
1.0, 1.1 |
Not Implemented |
|
502 |
1.0, 1.1 |
Bad Gateway |
|
503 |
1.0, 1.1 |
Service Unavailable |
|
504 |
1.1 |
Gateway Timeout |
|
505 |
1.1 |
HTTP Version Not Supported |
For the full definitions of the HTTP protocol standards, including the full set of requests supported, see the RFC 1945 (HTTP 1.0) and RFC 2616 (HTTP 1.1) documents at http://www.w3.org/Protocols/. For further information about the Common Log format, see http://www.w3.org/Daemon/User/Config/Logging.html.
Viewing the Common Log Files
To view the contents of a Common Log file, locate the file you want within the log directory and use any ASCII text editor or file viewer. For in-depth analysis of the file, you may consider using a tool such as WebTrends FireWall Suite (about which more information can be found later in this AppNote) or BRDSTATS. BRDSTATS is a free tool which can be downloaded from Novell's Cool Solutions Web site at:
http://www.novell.com/coolsolutions/zenworks/features/tips/ t_borderstats_zw.html
Example Common Log File Excerpt
The brief log excerpt below shows activity for two users, using IP addresses 10.1.1.4 and 10.1.1.2. The user at IP address 10.1.1.4 was authenticated as john.sales.acme and has accessed http://www.altavista.com/, whilst the user at IP address 10.1.1.2 was authenticated as .admin.acme and has accessed http://support.novell.com/. An additional carriage return has been inserted between each line for ease of reading.
10.1.1.4 - .john.sales.acme - [03/Aug/1999:12:06:54 +0000] "GETttp://www.altavista.com/av/gifs/dart.gif HTTP/1.0" 304 00.1.1.2 - .admin.acme - [03/Aug/1999:12:07:14 +0000] "GETttp://support.novell.com/ HTTP/1.0" 200 288500.1.1.2 - .admin.acme - [03/Aug/1999:12:07:41 +0000] "GETttp://support.novell.com/images/support_nav_bar.gif HTTP/1.0" 200 32640.1.1.2 - .admin.acme - [03/Aug/1999:12:07:43 +0000] "GETttp://support.novell.com/images/support_conn_title.gif HTTP/1.0" 200 14080.1.1.2 - .admin.acme - [03/Aug/1999:12:07:51 +0000] "GETttp://support.novell.com/images/nav_before_call.gif HTTP/1.0" 200 485
Extended Log Files
Just as with the Common Log file, the Extended Log file also consists of text fields which record outbound access to the web via the proxy. However, the format of the data recorded differs from the Common Log, as can be seen below.
Enabling the Extended Log
The Extended Log is enabled by checking the "Extended" Logging Format option on the "Logging" tab of the Application Proxy configuration screen, as shown in Figure 2.
Configuring the parameters for the Extended Log file.
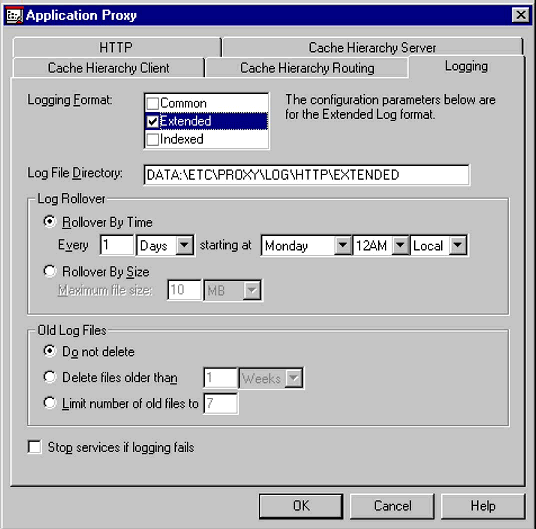
Configuration Parameters for Extended Log Files
Additional configuration information may be provided at this point, as described below.
Location of the Extended Log Files. By default, the BorderManager Extended Log files are stored in the following directory:
volumename:\ETC\PROXY\LOG\HTTP\EXTENDED
This can be changed to another location, if desired. It is recommended that a volume other than SYS be used for storing the Extended Logs.
Controlling the File Size. Depending on the Log Rollover option chosen, there will either be one file per day (Rollover By Time), or a series of files named by date of creation (Rollover By Size). To change the rollover configuration, select the desired option in the screen shown in Figure 2 above.
The amount of disk space consumed by the files can be controlled by the "Old Log Files" options.
Contents of the Extended Log File
Information in the Extended Log file is stored in the following format:
|
Field
|
Description
|
|
cached |
A value indicating whether or not the URL was retrieved from cache. Possible values are: cache miss cache hit non-cachable pattern (dynamic content) |
|
[date-time] |
Date and time of the event, including the time zone ffset relative to GMT (for example, [03/Dec/2001:12:07:41 +0000]) |
|
c-ip |
IP address of the client (for example, 10.1.1.2) |
|
cs-method |
The HTTP request type (for example, GET) |
|
cs-uri |
The URL of the site being accessed (for example, http://support.novell.com/images/ support_nav_bar.gif) |
For further information about the Extended Log file format, see http://www.w3.org/TR/WD-logfile.html.
Viewing the Extended Log Files
To view the contents of an Extended Log file, locate the file you want within the log directory and use any ASCII text editor or file viewer.
Files in Extended format can also be analysed using a tool such as Softcab's Active LogView. More information about this software can be found at:
http://www.softcab.com/logview/index.asp
Example Extended Log File Excerpt
The brief log excerpt below shows the same activity as in the Common log example above for two users, using IP addresses 10.1.1.4 and 10.1.1.2. The user at IP address 10.1.1.4 has accessed http://www.altavista.com/, whilst the user at IP address 10.1.1.2 has accessed http://support.novell.com/. An additional carriage return has been inserted between each line for ease of reading.
4 [03/Aug/1999:12:06:25 +0000] 10.1.1.2 GET http://www.altavista.com/cgi-bin/query?pg=q&kl=XX&stype=stext&q=Eclipse+1999 [03/Aug/1999:12:06:54 +0000] 10.1.1.2 GET http://www.altavista.com/av/gifs/dart.gif [03/Aug/1999:12:07:14 +0000] 10.1.1.2 GET ttp://support.novell.com/ [03/Aug/1999:12:07:41 +0000] 10.1.1.2 GET ttp://support.novell.com/images/support_nav_bar.gif [03/Aug/1999:12:07:43 +0000] 10.1.1.2 GET http://support.novell.com/images/support_conn_title.gif [03/Aug/1999:12:07:51 +0000] 10.1.1.2 GET http://support.novell.com/images/nav_before_call.gif [03/Aug/1999:12:07:54 +0000] 10.1.1.2 GET http://support.novell.com/images/clearpixel.gif [03/Aug/1999:12:07:59 +0000] 10.1.1.2 GET http://support.novell.com/images/nav_pref_serv.gif
Indexed Log Files
The BorderManager Proxy Indexed log is created within a Btrieve-based file which maintains a number of logs for use by BorderManager. This differs significantly from the Common Log and Extended Log files which can be read as plain ASCII text by any program. Reading the Btrieve format for the Indexed Log requires special tools provided by Novell for this purpose.
The BorderManager Proxy Indexed log is created within a Btrieve-based file which maintains a number of logs for use by BorderManager.
Enabling the Indexed Log
The Indexed Log is enabled by checking the "Indexed" Logging Format option on the "Logging" tab of the Application Proxy configuration screen, as shown in Figure 3.
Configuring the parameters for the Indexed Log file.

As can be seen from the screen shot in Figure 3, there are no configuration options available for Indexed Log files. It is therefore not possible to change the default location of the Indexed Log file, which is stored in Btrieve format at:
SYS:SYSTEM\CSLIB\CSAUDIT.LOG
Since this log will always reside on the SYS volume, the space implications of indexed logging should be considered before enabling this type of log, especially if space on the SYS volume is already at a premium.
The CSAUDIT command can be used at the server console to limit the space used by the Indexed Log files. Please consult the BorderManager documentation for further information
Contents of the Indexed Log File
This Btrieve log file may be accessed using a number of methods, including NWAdmin, ODBC, CSAUDIT.NLM, and BUTIL.NLM.
The CSAUDIT file is defined for software developers as follows:
typedef struct CSAT_Common_s u32_t AuditEntryType;u32_t Reserved;u32_t ActivityNo;LONG AuditEventTime;char ProductId [MAX_PRODUCT_ID_LEN];char UserName [CSAT_USER_NAME_LEN];u32_t RecordNo;char ResourceName1 [CSAT_MAX_RESOURCE_NAME_LEN];char ResourceName2 [CSAT_MAX_RESOURCE_NAME_LEN];union {char ResourceName3 [CSAT_MAX_RESOURCE_NAME_LEN];u32_t ResourceValue [CSAT_MAX_RESOURCE_NAME_LEN/sizeof(u32_t)];} ResourceData;u32_t ResourceId1;u32_t ResourceId2;u32_t ResourceId3;struct {u32_t Network;u8_t Node [NODE_ADDR_LEN];} NetAddr; CSAT_Common_t;
The file CSAUDIT.H, included with the Novell Developers Kit, describes the CSAUDIT.LOG file in more detail. In most cases it will not be necessary to manipulate this file directly. Instead, the log file can be exported for use by other software.
Exporting the Indexed Log File
To export the contents of the HTTP Proxy indexed log file, carry out the following steps in NWAdmin:
Highlight the file server running BorderManager.
Select "Tools" from the main menu.
Select "Novell BorderManager".
Select "BorderManager" from the new option on the main menu.
Select "Export Logs".
From the dialogue box which appears (see Figure 4), check just the HTTP Proxy option in the Log Selection section, then click OK.
Setting the Log Export Options.

The chosen filename will be created in a directory called "HTTP", within the path specified in "Export Destination". The file contains the HTTP proxy log data extracted from the indexed file, in ASCII text format.
CSAUDIT Error Codes
A number of error codes are defined for operation of the CSAUDIT components. If CSAUDIT errors occur, one of the following errors may be displayed on the file server console.
|
Error Code
|
Meaning
|
|
0x00240001 |
Asked for a product, but got none |
|
0x00240002 |
Invalid parameter |
|
0x00240003 |
Product already defined |
|
0x00240004 |
Invalid data in config structure |
|
0x00240005 |
Single record is too large to read |
|
0x00240006 |
End Of File |
|
0x00240007 |
Client needs to do a ReadFirst/Last before Prev/Next |
|
0x00240008 |
CSAT_Init has already been called |
|
0x00240009 |
Cannot create the audit trail task |
|
0x0024000a |
CSAT_Init has not been previously called |
|
0x0024000b |
Too many .ARC files in Audit Trail directory |
|
0x0024000c |
The Btrieve "stat" function returned an error |
|
0x0024000d |
The SetFileInto function returned an error |
|
0x0024000e |
Cannot rename tmp archive into real archive |
|
0x0024000f |
Cannot register as an NLM library |
|
0x00240010 |
Cannot create the necessary Audit Trail subdirectories |
For assistance in resolving Btrieve-related errors, refer to "Btrieve in the NetWare Server Environment", Novell AppNotes, February 1999, available online at:
http://support.novell.com/techcenter/articles/ana19990205.html
Using WebTrends Firewall Suite
WebTrends Firewall Suite is a software program which can be used to analyse the Common log files produced by BorderManager. The software can be downloaded from the WebTrends Web site at:
http://www.webtrends.com/products/firewall/
WebTrends Configuration
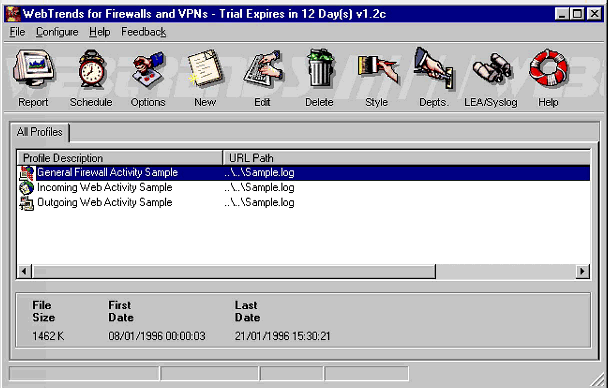
Figure 5 shows the screen displayed when the program is run for the first time after installation. Three sample reports are provided, showing "General Firewall Activity", "Incoming Web Activity", and "Outgoing Web Activity".
Initial screen when WebTrends for Firewalls and VPNs is run the first time.
The following steps show how to create a new profile to analyse the outgoing Web activity for the BorderManager Proxy Cache component.
From the initial screen, click the icon indicating "Create a New Profile", as shown in Figure 6.
Clicking on the icon to create a new profile.

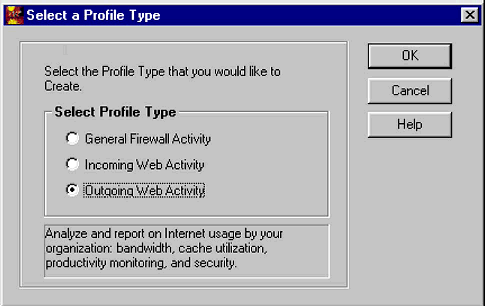
In the next dialogue box (shown in Figure 7), choose "Outgoing Web Activity" and click OK. This is the only type of activity which can be reported when using WebTrends with Novell BorderManager.
Selecting the "Outgoing Web Activity" profile type.
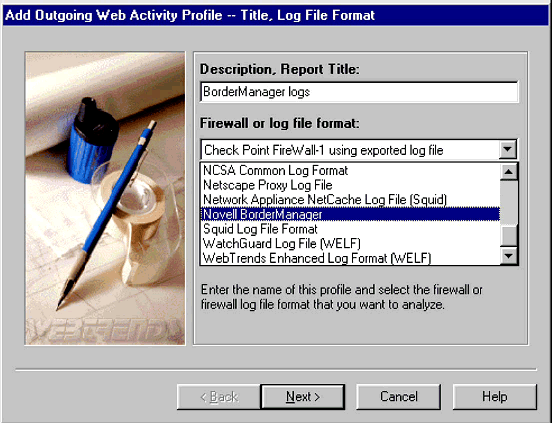
In the next screen (see Figure 8), choose a meaningful title (name) for the report, then select "Novell BorderManager" from the pull-down list of log file formats which is presented.
Naming the report and selecting the log file format.
Click the Next > button to continue.
In the next screen (see Figure 9), choose the location of the log files.
Setting the log file path.
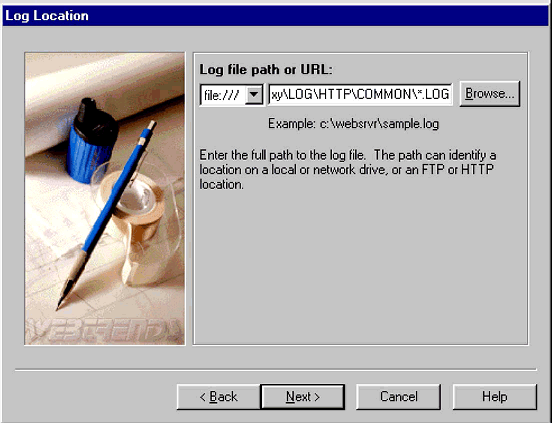
The path will normally be:
volumename:\ETC\proxy\LOG\HTTP\COMMON\*.LOG
where volumename indicates the volume on which the BorderManager log files are maintained. As explained above, the common log files are currently the only BorderManager log type which can be processed by the WebTrends software.
Click Next > to continue.
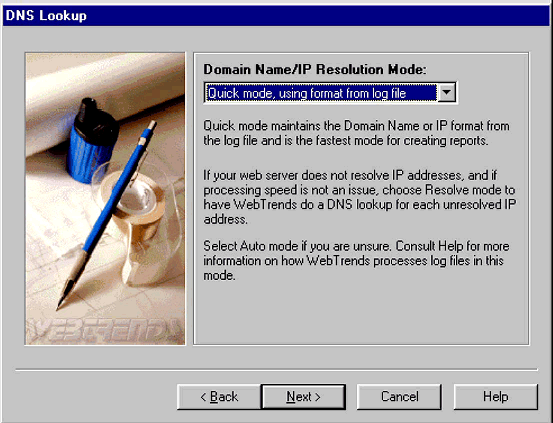
Next, choose the method by which Domain Names will be resolved by the WebTrends program (see Figure 10). The default "Quick mode, using format from log file" will result in the fastest resolution of domain names.
Setting the Domain Name/IP Resolution Mode.
Click Next > to continue.
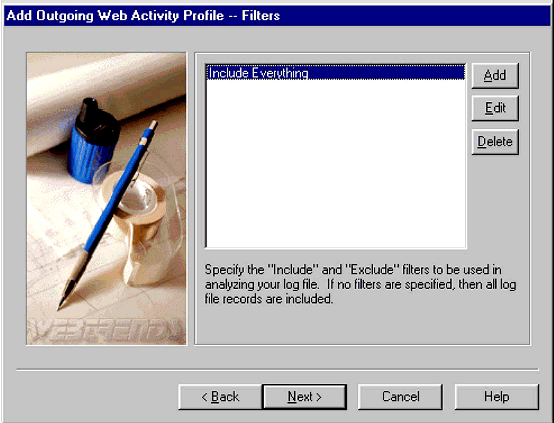
At this point it is possible to choose which activity will be analysed (see Figure 11). If you want to analyse the whole of the log, select "Include Everything". Otherwise, click on the Edit button and make specific choices of what should be included or excluded.
Adding filters to the Outgoing Web Activity Profile.
Click Next > to continue.
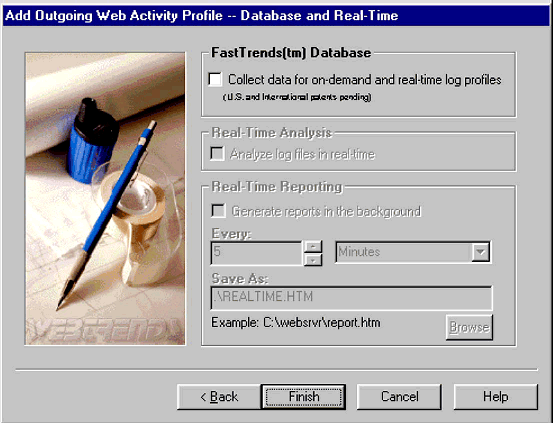
In the next screen (see Figure 12), ensure that the option for the FastTrends Database is not checked.
The FastTrends Database option should not be checked.
Click on the Finish button.
The list of available reports will be refreshed and will now include the newly-created report for BorderManager logs (see Figure 13).
The main screen with the new report listed.

Running a Report
To run a report from the list, double-click on the Report button. The dialogue box shown in Figure 14 is displayed.
Creating the BorderManager logs report.
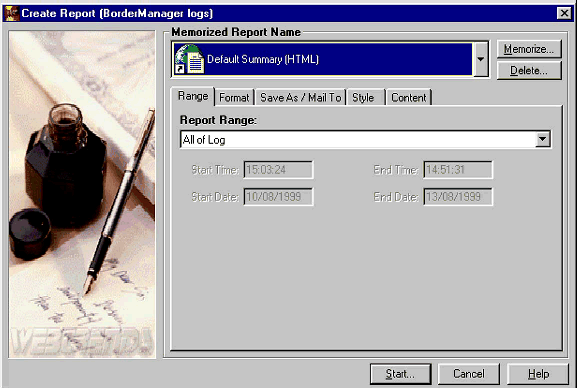
Click on the Start button to begin the processing of the BorderManager common log files.
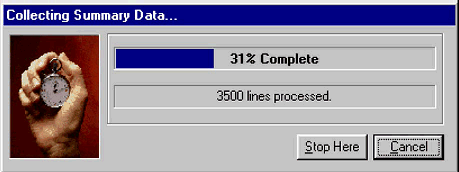
Two types of progress screens will be shown. The first, "Collecting Summary Data" (see Figure 15), is displayed when the common log file information is being gathered.
The "Collecting Summary Data" progress screen.
The other, "Building Summary Report" (see Figure 16), is displayed when the data analysis and report file generation takes place.
The "Building Summary Report" progress screen.

Following this stage, the WebTrends program will invoke the preferred browser and display the summary report in HTML format, as shown in Figure 17.
The BorderManager logs summary report is displayed in HTML format.

From this report, you can see the following:
General statistics
Visited sites
Top users
Resources accessed
Activity statistics
Technical statistics
Conclusion
As can be seen from this AppNote, Novell BorderManager provides a variety of options for logging the use of the HTTP Proxy component. Further information about Novell BorderManager can be found in the following resources:
Novell BorderManager online documentation at http://www.novell.com/documentation
"A Beginner's Guide to BorderManager" and "Novell BorderManager: A Beginner's Guide to Configuring Filter Exceptions", by Craig Johnson, available at http://nscsysop.hypermart.net/
BorderManager Resources page at http://www.connectotel.com/border
* Originally published in Novell AppNotes
Disclaimer
The origin of this information may be internal or external to Novell. While Novell makes all reasonable efforts to verify this information, Novell does not make explicit or implied claims to its validity.