Troubleshooting and Diagnosing NetWare 5.1 Server Problems Through the NetWare Management Portal Utility
Articles and Tips: article
Software Engineer
Novell, Inc.
Richard Keil
Software Engineer
Novell, Inc.
01 Apr 2000
The NetWare Management Portal utility (or "Portal" for short) not only allows network administrators to manage their NetWare 5.1 servers through a Web browser interface, it can act as a server health monitor, providing a list of 17 potential "hot spots" that could cause problems. The Portal utility is a great tool to help troubleshoot and diagnose those hot spots to find out what is actually causing problems. Once administrators have gathered appropriate data about the problem and identified which NetWare Loadable Module (NLM) is causing the problem, they can speak more competently to the manufacturer about the offending program.
This AppNote describes how to use the Portal utility to diagnose and resolve six scenarios that affect server operation:
A program or NLM is hogging the server CPU
A server module is using a large amount of memory
An errant program is causing the server to abend
A program is monopolizing server processes
Users are filling up disk space on server volumes
A file is locked and inaccessible to users
- Simulating Server Problems
- Tracking Down a CPU Hog
- Finding High Memory Users
- Tracing the Source of an Abend
- Locating a Server Process Hog
- Finding Disk Space Hogs
- Seeing Who Is Using a Locked File
- Conclusion
Simulating Server Problems
In this AppNote, we will present examples of how use the NetWare Management Portal as a tool in the following server troubleshooting situations:
Tracking down a CPU hog
Finding high memory users
Tracing the source of an abend
Locating a server process hog
Identifying disk space hogs
Seeing who is using a locked file
To better illustrate the diagnosis and resolution of these server-related problems, we have created a demo program called Problems For Portal (PROBLEMS.NLM). Once this NLM is loaded on a NetWare server, it can be used to simulate various server scenarios such as CPU hogs, high memory users, abends, and process hogs.
Note: PROBLEMS.NLM is available on the Novell Research Web site. It is provided "as is" and is to be used only on test servers, not in a production environment. To download this software, go to the following URL and look for the Problems For Portal entry in the list of downloads: www.novell.com/research/downloads.htm"
Tracking Down a CPU Hog
The first troubleshooting scenario we will cover is tracking down a CPU hog. This could be a program that is poorly designed or has become corrupted and, as a result, is using up so much of the server's CPU cycles that other programs are not able to run properly.
To simulate a CPU hog, load PROBLEMS.NLM on your test server and select the "Utilization Hog" option from the list of server problems. Now, go to the Portal utility (which can be run from any workstation that has Internet access) and log in to the test server.
Note: The Portal login process is explained in a previous AppNote entitled "An Overview of NetWare 5.1's Management Portal Utility" in the January 2000 issue of Novell AppNotes, see www.novell.com/research/appnotes/2000/january/04/index.htm.
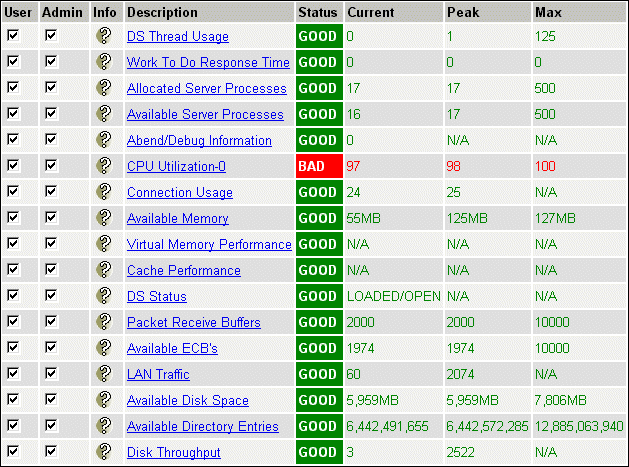
Once you have logged in through Portal, notice that the Server Health Information traffic light icon is showing red instead of green. This indicates a problem. Click on the traffic light icon and you will see the Server Health Monitor screen (see Figure 1) which is the list of 17 "hot spots" we alluded to in the introduction to this AppNote. In this example, the CPU Utilization status is displaying "BAD" in red, and the current server utilization is 97%.
Figure 1: Clicking on the traffic light icon from Portal's initial screen brings up the Server Health Monitor screen, which allows you to check the status of 17 server hot spots at a glance.
To find out why this server has such high CPU utilization, we'll use some of Portal's other options to see information about the programs or "threads" are currently in use on the server.
Viewing CPU Utilitzation Information
Click on the Home button to return to Portal's home page. Then, under the Server Management option, choose the Profiling and Debug Information option. The initial display shows CPU utilization by thread. You can see the names of the threads currently in use in the system, as well as the percentage of the execution time these threads are currently using.
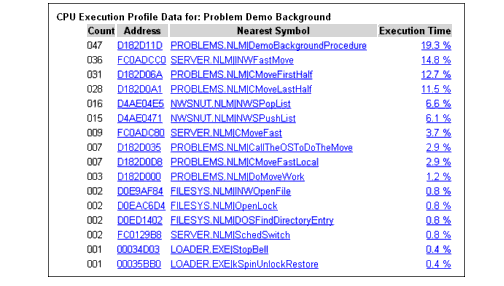
Under the Execution Profile Data by Thread heading, you can see the Thread Name, the Thread ID, the Thread State, the Parent NLM of the thread, and the Execution Time. If you click on the execution time, you can see where this specific thread is actually spending its time running, broken down by procedure and percentage of time per procedure (see Figure 2).
Figure 2: The Thread Execution Profile shows the Count (how many interrupts are mapped to the corresponding address), the Address (where in memory the selected thread is spending most of its time), the Nearest Symbol (to the executing thread), and Execution Time (as a percentage of total CPU utilization).
From the Profiling and Debug Information page, you can also select the Profile CPU Execution by NLM option, which shows you the Profile Data by NLM, the NLM Name, the NLM Description, and the Execution Time (see Figure 3).
Figure 3: The Execution Profiling by NLM screen shows you which NLMs are currently taking up CPU time on the server.
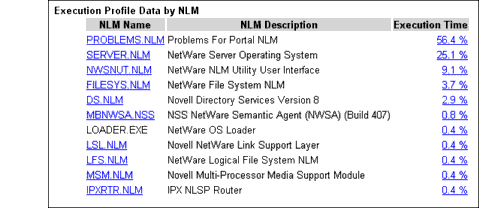
Here you can see that the server is spending 56.4% of its time running the Problems For Portal NLM, 25.1% of its time running the NetWare Server Operating System, and another 9.1% running the NetWare NLM Utility User Interface. A small percentage goes to the NetWare File System NLM and various other NLMs.
If you click on the Execution Time of the first NLM in the list (Problems For Portal), you will see a breakdown of where the processor is spending the most time. In this example, 18% of the server's CPU bandwidth is spent calling the PROBLEMS.NLM | DemoBackgroundProcedure. If you click on the Address, you will see the Disassemble Code page for that procedure (see Figure 4). Here you can view the actual instructions, and from that you'll get a clearer picture of where the NLM is spending its time.
Figure 4: From the Disassemble Code page, you can view actual calls at the code level.
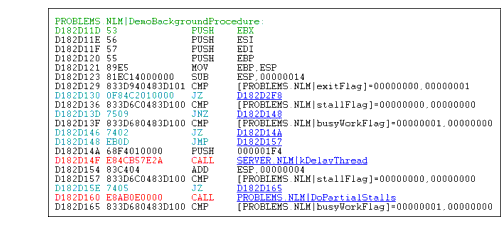
Some of the entries on this page are color coded to make it easy to find the calls and jumps in the code, which are often the most important elements in the program flow. Green indicates the start of a procedure; red indicates a CALL; and blue indicates a JMP (jump) instruction. You can click on the addresses associated with calls and jumps to disassemble code at those locations.
Looking for the Nearest Symbol
Once you identify an offending NLM through the Portal utility, you can follow the Nearest Symbol information for that NLM to see specifically which part of the NLM is causing the problem. To do this, we need to look at call traces.
For this example, go to the Execution by Profiling NLM screen and click on the Execution Time entry for SERVER.NLM. Next, to perform the call trace, choose a procedure such as the SERVER.NLM | AllocMemoryDefault entry under the Nearest Symbol column. This will show you which NLMs are calling for memory allocation, and how frequently this procedure is being called for during the one-half second profile displayed on the screen (see Figure 5).
Figure 5: From this screen, you can see which NLM is calling for certain procedures to be performed.

By clicking on the Nearest Symbol entries, you can trace each procedure, including the one that is being called the most often (indicated by the highest Call Count). From here, you can walk up the stack in real time and see which NLM is causing that area of the operating system or library to be executed. At any time, you can click on the Address Called From entry and drop into the Disassemble Code page.
This real-time diagnosing effort can be a boon to programmers and developers who want to know how their NLMs are affecting the NetWare Operating System, as well as how the NetWare OS and its corresponding NLMs are affecting the NLMs under development. Network administrators can also use this method to see how NLMs affect one another, and then use this information to pinpoint NLMs that are not functioning correctly on their NetWare 5.1 servers.
Finding High Memory Users
Our next example will illustrate how to track down a high memory user on a NetWare 5.1 server. To simulate this situation, select the Memory Hog option from PROBLEMS.NLM. Then click the Home button to return to the initial NetWare Management Portal utility screen. Again, the traffic light icon is red. Click on the icon to go to the Server Health Monitoring screen, which now shows the status of the Available Memory entry is "BAD."
To track down where the server's memory has gone, click on the Available Memory entry. This brings up the System Memory Information screen, which shows you how memory is currently being allocated (see Figure 6).
Figure 6: The System Memory Information screen shows how memory is being allocated. It also allows you to view memory usage graphically.
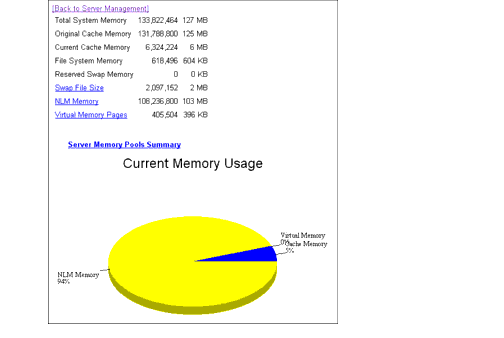
From the System Memory Information screen, click on NLM Memory to bring up a list of all of NLMs that are using memory. This will bring you to the NetWare Loadable Modules Information screen, which has clickable buttons to sort the memory listing by the following categories: Name (in alphabetical order), Code, Data, Alloc Memory, NLM Total (in bytes) and NLM Total. Clicking on the Alloc Memory category, for example, displays which NLMs are using the most memory, from highest to lowest (see Figure 7).
Figure 7: Clicking on the Alloc Memory category displays the server modules' memory usage, from the most to the least.
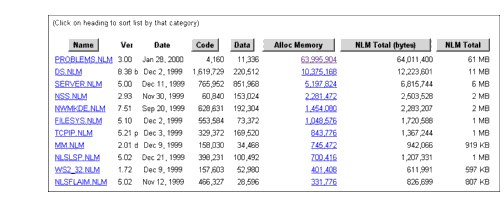
In this case, you can see that PROBLEMS.NLM is using about 61MB of memory.
To get a breakdown of the memory this NLM has in use, click on the Alloc Memory entry for the Problems For Portal NLM, which brings up the PROBLEMS.NLM Allocation Summary screen. By clicking on the Display Memory Allocation Information by Size entry at the bottom of the screen, you can see a further breakdown of how memory is being allocated (see Figure 8).
Figure 8: The pieces of memory that make up the total memory allocated.
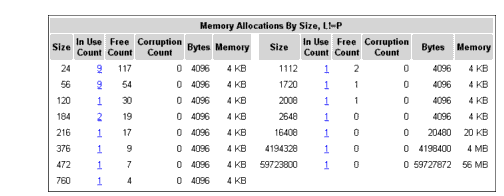
In this example, PROBLEMS.NLM has in use nine pieces of memory that are 24 bits in size, nine that are 56 bits in size, and so on, down to one piece that is 56 MB (59,723,800 bits) in size.
If you click on the In Use Count column, you will see a list of the actual addresses showing where these pieces of memory are in use (see Figure 9). If you click on one of the addresses, you can actually view the contents of memory at that location.
Figure 9: This listing shows the NLM's In Use Allocations, along with their Size and memory Type.
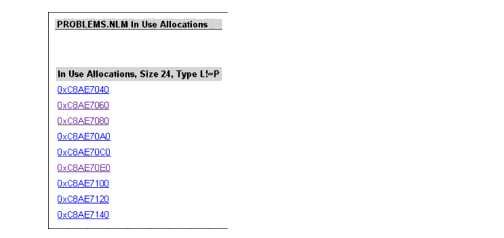
This troubleshooting procedure has illustrated how to track down a heavy-duty memory user and show the individual pieces of memory that an NLM has in use.
Tracing the Source of an Abend
The next example will be of tracing the source of a server abend, or Abnormal End of a piece of server code. To simulate this problem, select the Page Fault option from PROBLEMS.NLM. When you return to the traffic light icon at Portal's initial screen, you will see that the traffic light has gone red again. Further investigation reveals that the Abend and Debug Information entry is lit up. This indicates a problem with an abend.
Clicking on the Abend and Debug Information entry takes you to the Execution Profile Data by Thread screen (see Figure 10). Here you can see that the thread named Problem Demo has been suspended by Abend Recovery, and that this thread is owned by PROBLEMS.NLM.
Figure 10: Identifying the thread and NLM that has been suspended by the server's Abend Recovery process.

To see exactly what is going on, first click on the thread name. From the Thread Information screen, you can go down to the Abend Description part of the screen and see that this thread experienced a Page Fault Processor Exception while it was executing. You can also see a listing of the Registers, Code Executed, and Stack information that the server was processing when it received a page fault process time call from PROBLEMS.NLM. If the thread is suspended by the Abend Recovery process, the state of the thread at the time of the abend is displayed, along with the reason for the abend and the code that was being executed at the time (see Figure 11).
Figure 11: Identifying the thread and NLM that has been suspended by the server's Abend Recovery process.
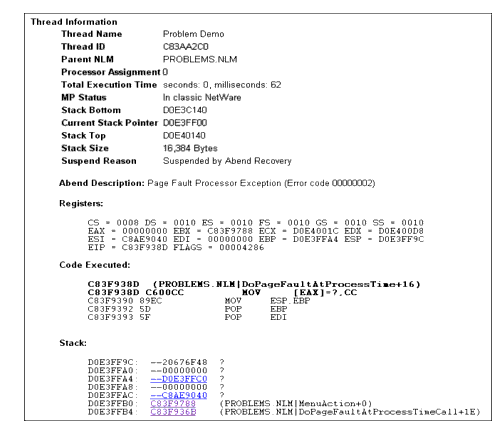
From this point, you can click on the stack address and perform some basic stack tracing (if you are familiar with interpreting assembly code). For example, click on the stack address C83F936B which held the (PROBLEMS.NLM | DoPageFaultAtProcessTimeCall+16) call to see the assembler code for that instruction.
Using this procedure, programmers can look at the current state of the thread that abended. They can also follow stack information to see how the program got to that state. Network administrators can use this information to look at the NLM information that is associated with the thread that had the problem. This can help them better determine if the NLM itself is having a problem or if the NLM is only having a problem when running with a certain other NLM.
In this case, you can resolve the problem by simply unloading PROBLEMS.NLM, which you can do right from the Portal utility. To do this, click on the Home button to return to the NetWare Management Portal utility's initial screen. Select the Server Management | Screens | System_Console options. At the bottom of the System Console screen, select System Console Input. You can then type in UNLOAD PROBLEMS (or whatever the name of your offending NLM is) and click the Execute button to send the command to the server console. (If you are impatient, you can set the Page Refresh rate to something faster than 10 seconds to see if your command has been executed.) Once the NLM unloads, you can reload the NLM through the same procedure (see Figure 12).
Figure 12: From the System Console screen, you can execute console commands remotely.
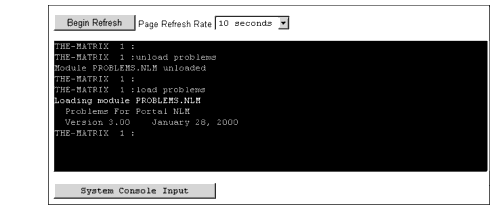
Once PROBLEMS.NLM is loaded, go back to the NetWare Management Portal utility's initial screen and select the traffic light icon. Once the screen refreshes, you can see that the Abend and Debug Information option has returned to normal and the server is back to a good state.
Note: You can also load and unload NLMs from the "Module List" page under Portal's "Application Management" option.
Locating a Server Process Hog
Next we will show how to use Portal to locate a server process hog, or an NLM that uses a lot of service processes. To replicate this situation, select the Server Process Hog option from PROBLEMS.NLM. When you click on Portal's traffic light icon, you see now that the Available Server Processes status has changed to "BAD."
To see what module is using up server processes, you can either click on the Abend/Debug Information option at the Server Health Monitoring screen, or you can click on the Home button, then select the Server Management | Profiling & Debug Information options. Both paths take you to the same place--the Profiling and Debug Information screen.
Since these server processes are already in use, go under the Execution Profile Data by Thread heading and click on one of the Thread Names, which shows under the Thread State heading that the thread is being "Delayed." Under the top column of the Thread Information screen and under the Suspend Reason entry, you can also see that this server thread is currently in a Delayed state. The Suspend Reason entry indicates what method the thread last used to yield the processor. For example, if the thread is blocked on a semaphore, the information about that semaphore is displayed. If the thread is a service process executing a "Work To Do," the information about the "Work To Do" is also displayed.
A short trace of the stack is also displayed. If you look down the Stack information, you see that this thread was scheduled by a "Work To Do" call that is owned by the PROBLEMS.NLM (see Figure 13).
Figure 13: Through the Stack information, you can trace which NLMs are calling for service processes.
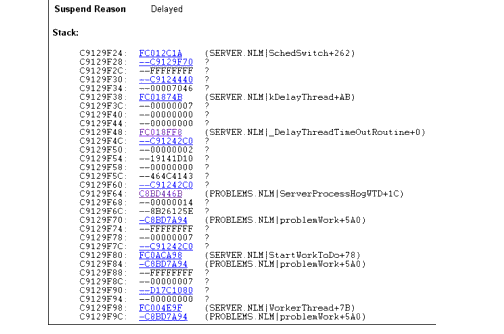
By clicking on the various calls, you can trace down the service process that is in use by the NLM to see how it is actually using the process, and you can look at the stack and see what that thread is using the service process call for--all in real time. If you start running out of server processes, this is a good way to track down where they are in use and how they are being used.
Note that there are different ways of listing threads. If you want to see every thread in the server, click on the "Additional Debug Information" link. This is the option to use if you are trying to find where all the service processes are executing. In the example above, we randomly selected a service process to see what it was doing. The other way to list threads is on the main Debug and Profiling page which lists the currently executing threads. If you are interested in service process hogs, you would typically select the most active thread in the list to track down active service processes. The "Additional Debug Information" screen is useful for tracking service processes that are currently blocked.
Finding Disk Space Hogs
Next, we will demonstrate methods for using the Portal utility to find a disk space hog. There isn't an option in PROBLEMS.NLM for creating a disk space hog, so we'll simply show how to see disk space usage. Start by selecting the Portal utility's Volume Management option (this option is located at the initial Portal screen that you see once you log in as Admin). From there, you can browse to see which directory on volume SYS is using the most disk space (see Figure 14).
Figure 14: The disk space amounts shown include the selected directory and all subdirectories.
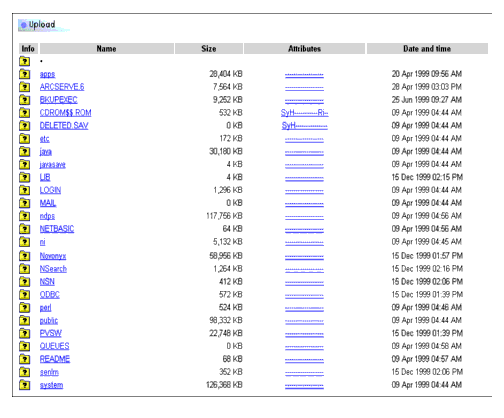
By clicking on the SYS volume from the Volume Management screen, you can see that the SYS:\Java directory and corresponding subdirectories are taking up about 30MB of disk space. The SYS:\NDPS directory and its subdirectories are using 117MB, while SYS:\PUBLIC and its subdirectories are using 98MB.
Click on the SYS:\PUBLIC directory to see where most of the disk space is being taken up. Further exploration shows that 49MB is found in the SYS:\Public\Mgmt directory path. Going into the Mgmt directory, you see that the SYS:\Public\Mgmt\CONSOLEONE directory and its subdirectories are using 18MB, while the SYS:\Public\Mgmt\CertConsole directory and its subdirectories are using about 16MB. You can keep drilling to see how much disk space the files and directories are taking up on any traditional NetWare volume (see Figure 15). This information is currently unavailable on NSS (Novell Storage Services) volumes.
Figure 15: Portal can show you disk space usage on traditional NetWare volumes.

From this brief exercise, you see that you can use Portal to quickly view which directories and subdirectories are using a lot of space on a volume. Through the Portal utility, you can track down where the space is being used.
Seeing Who Is Using a Locked File
Lastly, we'll look at an example where you want to find out who is using a file and how that file is being locked. To set up this scenario, select the Lockup File SYS:TESTDB.DAT option from PROBLEMS.NLM. You can view all sorts of information about files by selecting Portal's Volume Management option (from Portal's initial screen once you log in). In this example, you would select the SYS volume and a file (such as TESTDB.DAT), and then click on the question mark icon at the far left of the file name, as shown in Figure 16.
Figure 16: Clicking on the question mark icon by the file name brings up this information page about the file.
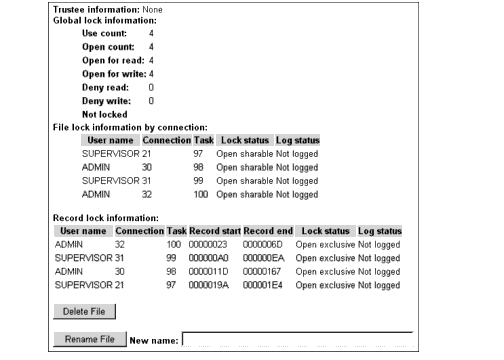
The File Information page shows that this file is currently in use and is opened four times. Through the Global Lock Information heading, you see that the file is presently is use, is opened four times, and is opened for both reads and writes. The File Lock Information By Connection portion of the screen shows the user's name, the connection number of the users that have the file opened, the task that has the file opened, the lock status of the file, and the log status of the users who have the file open.
Under the Record Lock Information heading, you can see the user name, connection number, task, lock status, and log status. You can also see the exclusive record lock offset information that each connection has acquired within the file. This information is located under the Record Start and Record End headings.
This information is similar to what you could see through the Monitor utility at the server console prompt. But while the Monitor utility can show you the connection number, it does not show you which user name is associated with that connection number. In Monitor, you would have to go through each user's information to find out where that user had record locks.
Click the Home button to return to Portal's initial screen. Then select the Server Management | Connection options. The Connection Information screen you see is divided into two parts: Connection Manager and Connections (see Figure 17).
Figure 17: Clicking on the Server Management | Connection option brings up the Connection Information screen, similar to what you see through the Monitor utility.
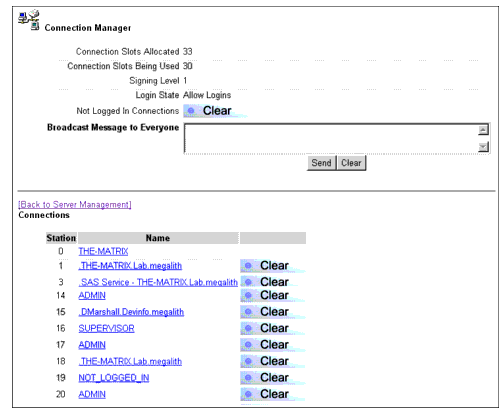
From the Connections portion of the screen, select one of the connections that has the TESTDB.DAT file open, such as user Supervisor on Station 16. The Connection Information screen for that user is displayed (see Figure 18).
Figure 18: The Connection Information screen shows which files this user currently has open.
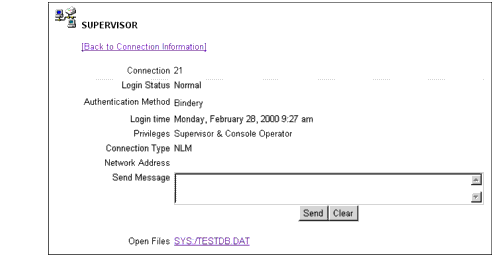
From the Connection Information screen, you can see that user Supervisor does indeed have the TESTDB.DAT file open. If you were to click on the file reference at the bottom of the screen, you would go back to the same File Information page that is displayed by clicking on the question mark icon to the left of a file name.
If you need to release a file that somebody has in use, you can go back to the Server Management | Connection option and clear that connection under the Connection portion of the screen. For this example, suppose we clear the Supervisor connection, then choose one of these Admin connections who also has the TESTDB.DAT file open. By clicking on the TESTDB.DAT file reference at the bottom of the screen, you now see that the Use Count has changed to three because we cleared the Supervisor connection earlier.
If you have ever had problems with a locked file, or need to know who has a file locked, or if you want to get the file unlocked for others to use, this procedure allows you to resolve these issues very quickly.
Conclusion
The Novell Management Portal utility is a great tool that can help system administrators and network managers to troubleshoot and diagnose the hot spots that you see through Portal's traffic light icon. The Portal utility can help find what is causing the problem, gather appropriate data on the problem, find out which NLMs are causing problems, and then be able to speak competently to the manufacturers of the offending program.
The Portal utility can also assist network administrators to also perform such activities as finding high memory users, tracking down abend problems, finding out where volume disk space is being used, as well as viewing and solving file lock issues. In fact, the more you use the Portal utility, the more uses you will find for this management utility.
Future articles will also describe how programmers can use the Portal utility to troubleshoot their NLM code when running on a NetWare 5.1 platform, as well as how to programmatically add their own entries into Portal's Health Monitor screen.
* Originally published in Novell AppNotes
Disclaimer
The origin of this information may be internal or external to Novell. While Novell makes all reasonable efforts to verify this information, Novell does not make explicit or implied claims to its validity.