An Overview of NetWare 5.1's Management Portal Utility
Articles and Tips: article
Senior Research Engineer
Novell Developer Information
01 Jan 2000
Now you can manage your NetWare servers remotely, from any Web browser, thanks to the innovative Management Portal utility in NetWare 5.1.
Introduction
Novell's release of NetWare 5.1 contains remote management capabilities through the NetWare Management Portal utility, or "Portal" for short. Portal uses an Internet browser to view and manage server information, similar to what you can do through the ConsoleOne and the MONITOR utilities. But because Portal uses HTML as its access protocol, you can access the server's vital information through any available Web browser (Netscape 4.5 and above, or Internet Explorer 5.x and above).
There are pluses and minuses to this management approach. Portal offers the same security as the Remote Console utility, which uses the Admin password (or another designated password) to access servers remotely. But if you like the flexibility of remote server access and your network isn't considered "at risk" from running remote access utilities, you will find Portal quite useful for managing your network server resources.
This AppNote describes the basic features and capabilities of the NetWare Management Portal utility. Future articles on this utility will cover each of the options in much more detail.
For more information about NetWare 5.1, visit the product Web site at:
http://www.novell.com/products/netware5
Installing the NetWare Management Portal
The NetWare Management Portal utility is a part of the NetWare 5.1 operating system software and is automatically loaded through the AUTOEXEC.NCF file. Once you install the NetWare 5.1 operating system or its upgrade kit, the NetWare Loadable Modules (NLMs) that Portal uses are placed in the SYS:SYSTEM directory and the *.HTM and *.GIF files are placed in the SYS:LOGIN directory.
PORTAL.NLM listens for Javascript recognition on port 80 from the browser that you are running. If you need to have the Portal server listen to a different port, you can change it by first entering the following command at the server console:
HTTPSTK.NLM /PORT:xx
where xx is the port you want to use. For example, if you want the Portal server to be listening on port number 60 instead of its default of 80, you would enter the command as follows:
HTTPSTK.NLM /PORT:60
Note: Be sure no other IP service is using the port you designate.
PORTAL.NLM loads the corresponding HTTPSTK module (for small HTTP interface support), the NWIDK module for CDWare Volume support, and the PARTAPI module for partition API support. If the server is running the CDROM or NSS (Novell Storage Services) modules, the PARTAPI module will already be loaded and won't load again.
Once you bring up a NetWare 5.1 server with PORTAL.NLM loaded, simply go to any workstation running a Netscape 4.5 or Internet Explorer 5.x browser and type in the IP address of the server running the NetWare Management Portal utility. If you have Domain Name Services (DNS) installed on your network for server name-to-IP address resolution, you can type in the server's name as it is known in DNS (such as http://portal.server.com) and the Portal utility will resolve the DNS name to the IP address. DNS name resolution will not work through a Network Address Translation (NAT) gateway.
Logging In to the Portal Server
To log in to the Portal server, click on the Login button. You will need to enter a username (Admin) and password for access to the utility's full network management capabilities. You can view some of the server's settings when not logged in, but you won't be able to perform many of the administrative functions Portal offers. For example, seeing individual server health components is configurable by the Admin user, and this can be totally blocked from viewing by unauthorized users. For the purposes of this AppNote, we assume you are logging in as user Admin so you have full access to Portal administrative functions.
The Portal Utility Screens
The following sections will describe the various main screens you will see in the NetWare Management Portal utility.
The Volume Management Page
The default screen that is displayed when you log in is the Volume Management page, which shows you the volumes that the server currently has mounted (see Figure 1). You can also see the server's DOS partition under the Local Server Partitions entry. (If you are not logged in, you will only see volume SYS grayed out.)
Figure 1: The Volume Management screen.
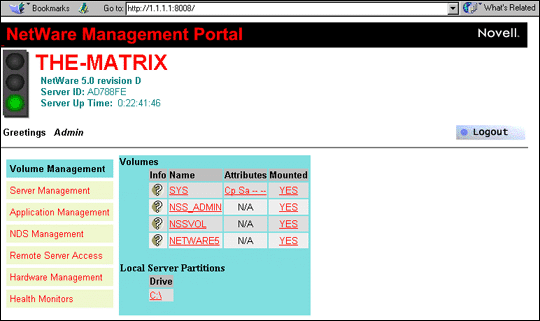
From the Volume Management page, you can set volume, directory, and file attributes, as well as copy, delete, rename, and create directories and files. The same applies to the server's local disk drive. You can also mount and dismount volumes as necessary. In the initial Volumes screen are columns labeled Info, Name, Attributes, and Mounted. (Currently, no volume or file attributes are supported for NSS volumes.)
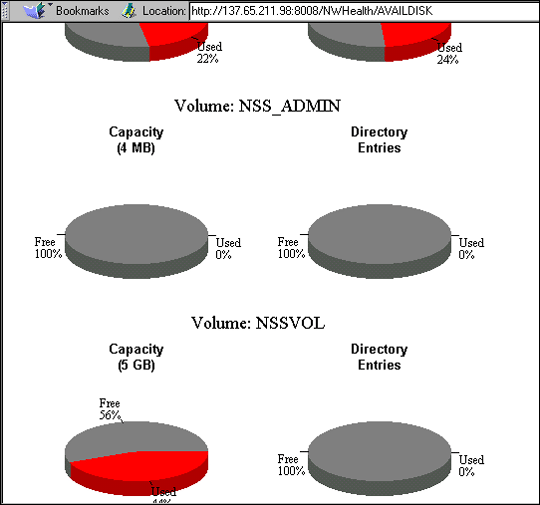
Clicking on a question mark (?) in the Info column brings up a graphic to display volume use as well as a list of other volume information, such as whether the volume is mounted, the file system type, which name spaces are loaded, compression and suballocation information, and so on (see Figure 2). From there, clicking on the current directory folder (.) icon shows information about that directory, including any salvageable files, along with a button to restore or purge them.
Figure 2: Viewing the volume capacity and directory entry usage information.
Clicking on the volume name from the initial Volume Management screen brings up that volume's file system structure, including subdirectories and files. Clicking on a volume's Attributes link shows you the attributes that can be set at the volume level. The traditional NetWare file system volumes display the volume's attributes; NSS (Novell Storage Services) and CD-ROM volumes do not currently display volume attributes.
The Server Management Page
The Server Management pages offer much of the same information that you see when using the Monitor utility. Clicking on the Server Management tab brings up a screen with the options shown in Figure 3.
Figure 3: The Server Management screen.
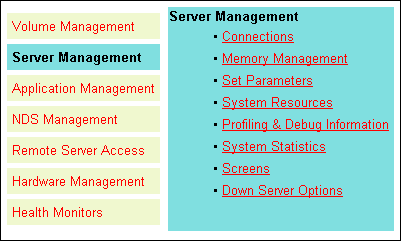
Connections. The Connections page shows you all of the connections that are currently being used and by whom. You can clear connections here or you can view the files the users have open on the server. You can broadcast a message to everyone, or if you highlight a particular connection, you can send a message to just that person.
Memory Management. The Memory Management screen shows you information about how the server is using memory. By clicking on the Server Memory Pool summary, you can see how the server's memory is being allocated to its memory pools. You can also see information on swap files, how the different NetWare Loadable Modules (NLMs) are using memory, and the virtual memory pages.
Set Parameters. The Set Parameters screen shows the server's internal settable parameters. These are the same parameters you see in the MONITOR utility, or if you type "SET "Enter"" at the server console. Future AppNotes will delve into these parameters, describing the theory of operations behind them as well as when and why you would want to change any of the parameters.
System Resources. The System Resources screen is the same information that you see on the System Resources screen in the MONITOR utility. Here you see a list of how server resources are being utilized, including which NLMs are using a particular resource, the resource tag description, and the number of resources that are currently checked out to the resource tag.
Profiling & Debug Information. This screen shows you which threads are currently executing on the server through this execution profile. If you want to see how much time the CPU is spending on each NLM, select the Execution Profiling by NLM option. Then by clicking on the Execution Time field, you can see on which threads the processor is spending its time. The Additional Debug options lists all of the threads presently running in the system, you can also select specific debug options. (We'll cover this more thoroughly in future articles.)
System Statistics. The Systems Statistic screen allows you to choose from the following entries: network management information, kernel statistical information, LSL statistical information, and media manager statistical information. Each entry shows you information pertaining to its particular area; for instance, the Media Manager Statistical Information screen shows you pending Input/Output information as it is currently and as it peaks. You can also see the I/O request rate and the data transfer rate, as well as current disk reads and writes.
Screens. This option offers a "view-only" screen of the server console. From the System Console screen, you can type server commands in a Command box, then press the Executebutton to actually send the information to the server's command line and execute the commands on the server.
Down Server Options. This screen gives you three choices: Down to down the server, Restart to down the server and restart it (cold boot), and Reset to down the server and then warm boot it.
The Application Management Page
The Application Management page brings up four options that you can use to perform the following functions on the server: Module List, Address Spaces / Memory Management, Registry, and Winsock 2.0 Management.
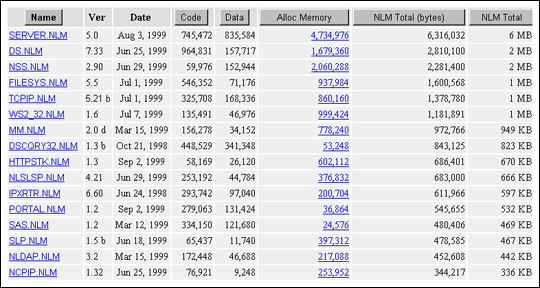
Module List. The NetWare Loadable Modules Information page shows you all of the modules that are loaded on the server. This is essentially what you see under the Loaded Modules option in the MONITOR utility; however, here you can load other modules and you can sort the list in any category by clicking on the category heading. So if you want to see which NLMs are taking up the most memory, you can click on the NLM Total heading to have the numbers sorted from biggest to smallest (see Figure 4).
Figure 4: Viewing information about NLMs loaded on the server.
Address Spaces / Memory Protection. This screen allows you to see which address spaces are loaded on the server. Depending on the NLM, you may be able to use memory protection to move misbehaving NLMs to address spaces that will not affect applications (and the NetWare operating system) that run in ring 0. From this screen you can load an .NCF file and all of the NLMs that are called from that file into a protected memory space, or you can simply load an NLM into a protected memory space. (Again, this depends on the NLM itself.) You can also view the memory SET parameters from this page.
Registry. The Registry screen displays the keys and values of Novell's server registry. While these values are not settable here, you can see how information about the server is organized. The Registry includes settings such as Settable parameters, hardware, software, and protocols. The main keys are divided into My Server, Performance Data, and Dynamic Data.
Winsock 2.0 Management. This screen displays the information about the active transport providers, active name space providers, as well as general socket statistics. You can also see global API counters, the Winsock 2 Socket list, and the Winsock 2 Application listing.
The NDS Management Page
Clicking the NDS Management tab brings up information on the following options: Tree Walker and NDS Partitions.
Tree Walker. The Tree Walker screen allows you to view a list of NDS objects attributes and values. If an attribute contains more than one value, those will be listed as well. For example, if you click on a user, you will see the attributes and values that are defined for that user (see Figure 5).
Figure 5: Viewing attributes and values for an NDS object.
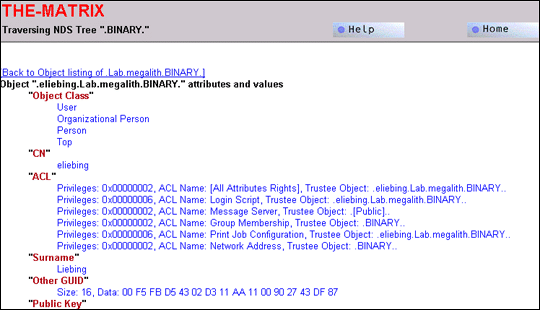
The more attributes and values are defined through the NWAdmin utility, the more fields you will see in this screen. For example, here is a list of all the attributes you would see for a User object:
Object Class
CN (Common Name)
ACL (Access Control List)
Surname
Other GUID
Public Key (encrypted)
Language
Home Directory
Security Equals
Full Name
Given Name
Title
Used By
Login Time
Password Allow Change
Password Minimum Length
Password Required
Last Login Time
Revision
GUID
Login Script
You can also delete the object from here; however, use this option wisely, as such an action is permanent. If you delete an object in error, you will have to reconstruct the object from scratch.
NDS Partitions. The NDS Tree Partition information page lists any NDS partitions and replicas that exist on this server. What you see are the partition name or replica name, the type of partition or replica it is, the current state of the partition or replica, and the name of the server that is holding the partition or replica.
The Remote Server Access Page
The Remote Server Access page allows you to see two types of server: portal servers and NetWare servers. Clicking the Remote Server Access tab brings up information on the following options: Portal Servers and NetWare Servers.
Portal Servers. The Portal Servers screen lists all of the servers that are currently running the NetWare Management Portal utility. You can access any of these servers by simply clicking on the server name. However, if you are to perform any real management functions, you'll need to log in as user admin with the correct password. This server list is collected using SLP (Service Location Protocol).
NetWare Servers. Clicking on the NetWare Servers tab brings you to the NetWare Server NCP Remote Access screen which asks if you wish to enable the remote file system access for servers that are in the same NetWare Directory Services tree as the server running Portal utility. Answering Yes to the question loads the NWRSA (NetWare Remote Server Access) module, a stub that allows you to browse NetWare servers that are in your NDS tree. This allows for remote access by using NCP (NetWare Core Protocol) packets and by using this Portal server as a proxy server.
The Portal utility displays the server list that SLP builds and from this list you can access NetWare servers that are in the same NDS tree as your current Portal server. If you click on the other servers that you see listed but which are not in your current NDS tree, you'll get an "Unknown status reply from server: -630!" error message. After clicking OK, you'll be told that the document has no data (a polite way of saying you have no rights to look at information on that server). Since there is no way to log in to the server at this point, access only those servers where you have Admin rights. You'll then see information that is similar to what is displayed through the Volume Management tab. You could use this option to copy files up to the servers which you have admin rights, only you won't see these any local drives for these servers.
The Hardware Management Page
Clicking on the Hardware Management tab brings up a page with the following options: Hardware Adapters, Processor Information, Hardware Resources, and PCI Device Information.
Hardware Adapters. This page lists the network and storage adapters that are loaded on this server. You can click on the question mark to see information about a storage adapter, or you can click on the adapter icon to see the driver's icon (if you see a NOT symbol, the driver is not active), its device name, device type, capacity, TID (Target ID for SCSI devices), LUN (Logical Unit Number), and the object identification (see Figure 6).
Figure 6: Viewing information about storage and network adapters.
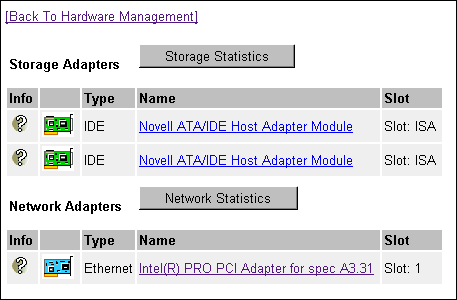
Clicking on the driver icon or device name brings up the partition information associated with this device. Here you will see such information as the partition types and sizes, its object ID, starting and ending sectors, number of redirected blocks and those blocks that are being used, and whether the partition is mirrored. Selecting the partition names show the volume segments. (Again, this is not fully supported for NSS volumes at present.)
If you select a network adapter instead of a storage adapter, you will see the information as it relates to network communication. If you click on the question mark next to the network adapter icon, you see information that is similar to the adapter information in the MONITOR utility, such as packets transmitted and received, packet overflow, and so onwhatever information this particular adapter driver displays about its communication traffic. You can also click on the Network Statistics button to see general Link Support Layer (LSL) information.
Processor Information. Clicking on this option displays information on all of the processors that the server currently contains. You will see the processor's speed, family, model, stepping capabilities, feature flags, ID, and local cache sizes. If the processor is a Pentium III or newer processor, you can also see the processor's serial number.
Many of the profiling operations performed by the NetWare Management Portal utility require at least a Pentium Pro processor or newer. If you have multiple processors, you can also bring these processors on-line or off-line from this screen (except for processor 0).
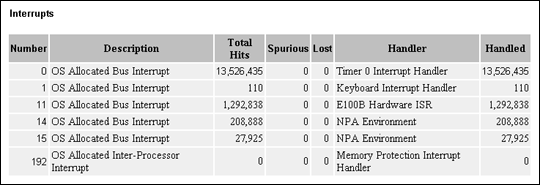
Hardware Resources. The Hardware Resources page shows various hardware information, such as interrupts, slots, ports, DMA. information, and shared memory. By clicking on each of these items, you can view the information that pertains to the particular selection. For example, clicking on Interrupts brings up a list of the active interrupts on the server, along with each interrupt's total number of hits, how many interrupt requests were spurious or lost, who has asked for the interrupt, and how many interrupts were handled (see Figure 7).
Figure 7: Viewing information about interrupt usage on the server.
PCI Device Information. This page shows a list of Hardware Instance Numbers (HIN) that represent a hardware device. Then as you select a HIN, you will see information that is stored in the PCI configuration space for that HIN, shown in two formats. The first format shows the field followed by the data that is stored in that field, while the second format shows the data followed by the PCI Configuration Space Header offset.
The Health Monitor Page
Perhaps you need a quick glance at how this server or a group of servers is running. The Health Monitor page gives you information about the servers you are responsible for through the following options: Server Health and Multiple Server Monitor (a Portal enhancement feature that you have to buy).
Server Health. You can reach the Server Health screen in two ways: through choosing the Server Health option from the Health Monitor tab, or by clicking on the traffic icon that you see as you first enter the NetWare Management Portal utility. Both methods will bring you to a Server Health Monitoring screen similar to the one shown in Figure 8.
Figure 8: The Server Health Monitoring screen.
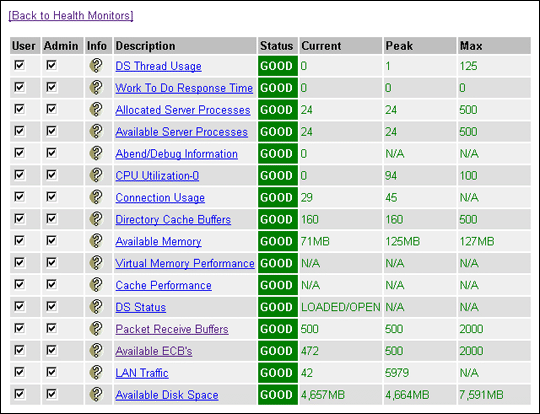
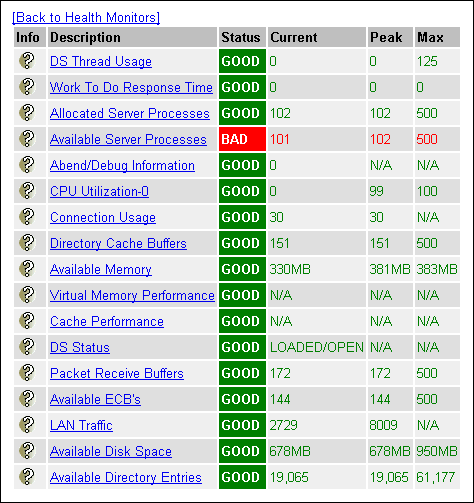
The Server Health Monitoring screen displays 18 different settings that Novell deems important to monitor in order to ensure server health. The columns across the top of the list include User, Admin, Info, Description, Status, Current, Peak, and Max(imum). The User column allows system administrators to control how much information those who attach to this server can see. For instance, if you unclick Connection Usage, those users running Portal without logging in as Admin won't see these monitor items present if they click on the traffic light icon.
Clicking the Question Mark to the left of a monitored item brings up help for that specific item. The Description column shows the items that are deemed important to keep watch on, while the Status column shows if the item is functioning within the bounds that it should. The Current/Peak/Max columns show what current resources are being used, the highest numbers that have been reached, and the maximum numbers that can be reached.
Several of the monitored items are settable parameters that you can reset if you need to. Clicking on a monitored item (such as Available Server Processes) will bring up a screen showing a history of how server processes have been allocated. Still other items, such as Available Memory, show you the same settings you saw from the System Memory Information screen on the Server Management page.
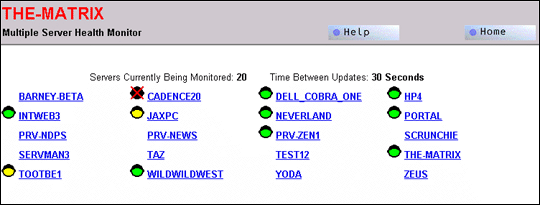
Multiple Server Monitor. The Multiple Server Monitor screen allows you to view at a glance the overall health of a number of servers, all from the same screen. From the Multiple Server Health Monitor Server List screen, you can click on the servers you want to monitor.
Once the desired servers are selected, you can use the Displayed Server Name Length to allow the whole server name be displayed (ALL) or only a few characters (such as 3). You can set the number of seconds between health updates. The default is 10 seconds, but you may need to increase this number by five seconds for each server being monitored. You can also specify the number of columns you want to see on the monitoring page (the default is 3). Click the Build Server Monitoring Page button to generate your customized page. An example is shown in Figure 9.
Figure 9: Getting a quick view of the health of multiple servers.
Note: Since the NetWare Management Portal utility uses Service Location Protocol (SLP) to communicate with servers running Portal, quite a bit of network traffic can be generated if you are not careful. To keep network traffic to a minimum, either keep your monitoring on the same network segment, or use SLP's Directory Agent to have a single source for finding available SLP services.
From the monitoring page, you can see the state of your selected servers. If the server shows a green traffic signal, that means server is in good health. If the traffic signal is yellow, one or more of the server's settings are pushing the limits. If the traffic signal is red, one or more of the server's settings have exceeded the limits. Clicking on that server's traffic light will show you a health screen similar to the one in Figure 10.
Figure 10: Checking the health of a server displaying a red traffic light.
If the server-monitoring applet cannot communicate with the server within the given time, you can increase the amount of time. If the server-monitoring applet loses communication with the server entirely, you'll see a black traffic light with a red cross over it.
Logging Out of the NetWare Management Portal
To log out of Portal, simply click on the Logout button that you see in the main Portal screen. You will be asked if you want to close this session of Portal. Answering Yes closes the browser window, which closes the Portal session.
Conclusion
The Novell Management Portal utility is designed primarily as a server health monitor, with additional diagnostic and debug capabilities that have previously been available only at the server console. In addition, Portal provides all of the functionality of the MONITOR utility (along with some functionality from other utilities) in a browser-based utility. Because of this all-in-one approach, the Portal utility contains quite a bit of information, which may be overwhelming to novice network administrators. Future AppNotes will take an in-depth look into each of the entries in the Portal utility.
* Originally published in Novell AppNotes
Disclaimer
The origin of this information may be internal or external to Novell. While Novell makes all reasonable efforts to verify this information, Novell does not make explicit or implied claims to its validity.