Collecting and Interpreting NetWare 4.x Server Statistics with STAT.NLM
Articles and Tips: article
Senior Research Engineer
Novell Developer Information
01 Aug 1998
Read all about the new version of STAT for collecting NetWare 3.x and 4.x statistics.
- Introduction
- Statistics Reported by STAT
- The Utilization Statistic
- The Dumpstat: A Simple Data-Formatting Tool
- Coming Attractions
Introduction
STAT.NLM has been a popular tool for gathering file server performance statistics ever since it was introduced in March of 1992 (see "STAT.NLM: A Tool for Measuring NetWare v3.11 Server Resource Utilization" in the March 1992 issue of Novell AppNotes).
Unfortunately, that venerable version of STAT was not compatible with NetWare 4.x. So last year, I wrote a NetWare 4 version of STAT.NLM, made it available on our download site on the Web, and published a quick NetNote about it (see "A New Version of STAT.NLM" in the NetNotes section of the June 1997 issue of Novell AppNotes).
Since that time, I have made some further improvements to STAT.NLM, primarily optimizing its own impact on CPU utilization.
This AppNote fulfills a promise I made in the June 1997 NetNote to provide a more complete article about how to use the NetWare 4 version of STAT. It also explains the new features of the latest version of STAT, which can be downloaded from
http://www.novell.com/coolsolutions/tools/13719.html
Statistics Reported by STAT
Our primary objective in writing STAT.NLM was to record the utilization statistic that appears on the server screen when MONITOR.NLM is running. Several other useful statistics came along for the ride.
The variables read and recorded by STAT include:
Number of Polling Loops. The number of times the Polling Process has been executed during the previous one-second interval. The Polling Process is the NetWare server's lowest priority process.
Maximum Number of Polling Loops. The maximum number of times the Polling Process has been executed during any one-second interval since the server was started.
Bytes Received. The number of bytes read from the LAN communications channel. This number is provided by the LSL services and therefore includes data from packets using the server as a router.
Bytes Transmitted. The number of bytes written to the LAN communications channel. This number is provided by the LSL services and therefore includes data from packets using the server as a router.
Bytes Read. The number of bytes read from the disk channel (hardware I/O).
Bytes Written. The number of bytes written through cache to the disk channel.
Packets Routed. The number of packets using the router services of the server only. This number is provided by the server's IPX protocol stack.
Number of Connections. The number of active connections to the server.
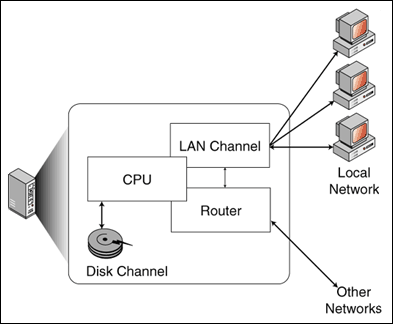
These statistics presume a simple model of a file server, illustrated in Figure 1. The server processes file service requests from workstations on the local or external networks, and routes packets between the networks. The server's CPU is impacted to varying degrees, depending on the nature of the service requested.
Figure 1: Simplified file server model.

The latest generation of intelligent network adapters can handle much of the work of routing packets without significantly impacting the server's CPU. File service requests impact the server's CPU, and LAN and disk channels. While the file server is optimized to route packets and service file requests very efficiently, NLMs loaded on the server can cause a significant load on the CPU.
For a little more information on the Polling Process and an illustration of how STAT.NLM can be used to analyze server performance, see "The Benefits of Using Intelligent LAN Channel Processing in NetWare Servers" in the May 1995 issue of Novell AppNotes. This article is available on the Web at
http://support.novell.com/techcenter/articles/ana19950501.html
The Utilization Statistic
Notice that STAT.NLM does not collect the file server utilization statistic. Utilization is calculated from the Number of Polling Loops and Maximum Number of Polling Loops statistics. STAT collects these two statistics, then DumpStat performs the calculation from the data STAT has collected. Not having STAT perform this calculation minimizes STAT's impact on the server while it is collecting statistics.
DumpStat (and MONITOR.NLM) calculate server utilization as follows:

Installing and Running STAT.NLM
Before running STAT, you should be sure your file server is running the latest version of CLIB.NLM, which can be downloaded from http://support.novell.com.
To run STAT, simply copy the file STAT.NLM to the SYS:SYSTEM directory on the file server you want to run it on, then type "LOAD STAT" at the file server console.
STAT gives you the option of manually starting data collection or setting a trigger time to start and stop collecting statistics. For example, by setting a trigger time, you can tell STAT to collect data between the hours of 8 a.m. and 5 p.m. each day.
STAT's data files are stored in the SYS:SYSTEM directory, and are named (by default) STAT.000, STAT.001, and so on. Each time STAT runs, the extension is incremented.
STAT Command Line Options
The latest version of STAT includes some command line options that help automate the data collection process. The options from STAT's help screen are shown in Figure 2.
Figure 2: Stat command-line options.
STAT: Performance Statistics Collection Module
version 4.11a

This program is an unsupported product of Novell Research Department,
Copyright (c) 1998, Novell, Inc.

Send questions/feedback to novell_research@novell.com

Usage:

LOAD STAT [/f:<filename>] [/start:<starttime>]
                        [/stop:<stoptime>]

/f		Specify output file name (8.3 format, extension must be numeric).
/start		Specify time to start collecting statistics. Must be in form
                        hh:mm:ss.
/stop		Specify time to stop collecting statistics. Must be in form
                        hh:mm:ss.
/r		Begin collecting statistics immediately.


/r option cannot be used with /start: or /stop: options.

If /start: is specified without /stop: (or vice-versa),
default time of 00:00:00 will be used for the other trigger time.
For example, you can put the command
LOAD STAT /r
in the server's AUTOEXEC.NCF file, and STAT will load and begin collecting data whenever the server is started. Other options allow you to specify start and stop trigger times on the command line.
DumpStat: A Simple Data-Formatting Tool
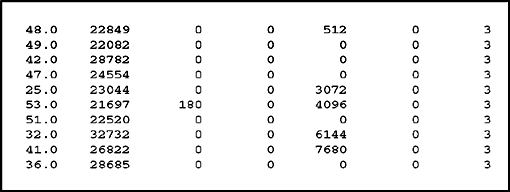
After you have used STAT.NLM to collect server utilization data, you can use DumpStat to view the data or convert it to a format that can be used by a spreadsheet or other data analysis tools. Sample output from DumpStat is shown in Figure 3.
Figure 3: Sample DumpStat output.

This sample data shows server utilization ranging from 25 to 53 percent in the first column, followed by the other statistics collected by Stat: Bytes Received, Bytes Transmitted, Bytes Read, Bytes Written, Packets Routed, and Number of Connections. The high utilization percentage on this server with only 3 users connected bears investigation. For example, an NLM loaded on the server may be impacting server performance.
Before running DumpStat, you should set the TZ environment variable to your local time zone. DumpStat has options to format data in columns (as shown in Figure 3 above), in a comma-delimited format that can be read by Lotus 1-2-3 and Quattro Pro, or in the tab-delimited format that can be read by Microsoft Excel. DumpStat's command-line options are shown in Figure 4.
Figure 4: DumpStat command-line options.
DUMPSTAT v4.11a - Novell Systems Research - 6/1/98

Usage: DUMPSTAT <inputPath< [<outputPath<] [-L|-X|-S|-Nnum|-M[num]<
    default output is stdout

    default output format is -L (Lotus format)


output path should not include extension (ext supplied by program).

DUMPSTAT creates output files <outputPath<.000,<
<outputPath<.001 . . ., and a summary file <outputPath<.SUM<<

formats are:

    -L   Lotus format   Comma delimited

    -X   Excel format   Tab delimited

    -S   Screen format  Fields justified in columns

                            (best format for screen or printer)

other options:

    -Nnum  Number of data items per output file (default 7200)

    -M[num]  Output only median of every num

          (default 60) records


You should set TZ environment variable to adjust for local time zone.

Example for Mountain time zone: "SET TZ=MST7MDT"

Exit status: 0 if successful, 1 otherwise
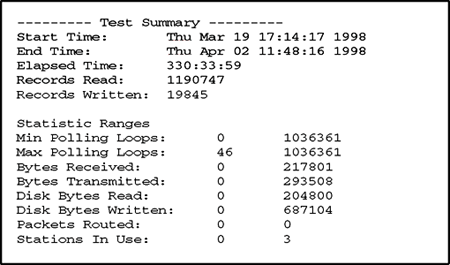
In addition to the formatted data, DumpStat produces a summary of the data collected, with the elapsed time and the minimum and maximum values for each statistic. A summary from one data run is shown in Figure 5.
Figure 5: DumpStat's summary of statistics collected by one STAT session.

Stat File Format
You may want to write your own DumpStat-like program to convert a STAT data file to a format that can be read by your data analysis tools. STAT's data file format is quite simple. The file begins with 2 long (time_t) values that represent the starting and ending timestamps for the file. Then for each second STAT is running there are eight unsigned long values for the eight statistics Stat monitors: Number of Polling Loops, Maximum Number of Polling Loops, Bytes Received, Bytes Transmitted, Bytes Read, Bytes Written, Packets Routed, and Stations in Use.
Coming Attractions
This version of STAT is not compatible with NetWare 5, Beta 2 ("Moab"). It will run and collect data, but the PollingLoops and MaxPollingLoops statistics are not correct, which makes the computed utilization value incorrect. What's more, the MaxPollingLoops value can be zero, which causes DumpStat to crash with a divide error. We will keep you informed regarding future developments in the area of server performance measurement and NetWare 5.
Disclaimer
The origin of this information may be internal or external to Novell. While Novell makes all reasonable efforts to verify this information, Novell does not make explicit or implied claims to its validity.