Charlotte: An Automated Tool for Measuring Internet Response Time
Articles and Tips: article
Senior Research Engineer
Novell Advanced Development
RICHARD LAMPLUGH
Senior Software Engineer
Novell Engineering
DON PORTER
Network Manager
UtahLINK
01 Jul 1998
Without a means to measure Web server response times, it is difficult to know just how fast--or slow--your intranet/Internet infrastructure really is. Charlotte is a simple tool to help you see the performance benefits of installing BorderManager's Web server acceleration and FastCache features.
- Introduction
- How Charlotte Works
- Charlotte Installation, Setup, and Troubleshooting
- Using Charlotte to Measure Web Response Times
- Case Study: Charlotte Shows Superiority of BorderManager FastCache at UtahLINK
- Conclusion
Introduction
Named after the famous spider in E. B. White's novel Charlotte's Web, Charlotte is an easy-to-use tool for measuring response time on the World Wide Web (WWW). Charlotte allows you to measure the end-user performance benefits of caching Web content at different locations within your extended network infrastructure. Using these measurements, you can easily determine which Novell BorderManager configurations produce the fastest response times for your user community. These measurements also provide your organization with documented justification for caching within your Internet and intranet infrastructures.
Charlotte measures Web response times by invoking the Netscape Navigator 4.x browser, opening a series of user-configurable URLs, and recording the response times for each URL transaction in a log file for later analysis. Using Web sites familiar to your users, Charlotte allows you to compare before-and-after performance to demonstrate the benefits of local browser caches, proxy caches, and Web server acceleration (reverse proxy caching). Charlotte can also be used to demonstrate BorderManager's performance advantages over caching products from other vendors.
Note: Charlotte is a freeware utility supplied on an as-is basis. It is not supported by Novell's standard support organization or affiliates, and we make no guarantees that it will be developed beyond the current version.
This AppNote provides an overview of how Charlotte works and how it is installed, along with some helpful troubleshooting tips. At the end are some usage examples to demonstrate how you can use Charlotte in a variety of performance analysis situations.
How Charlotte Works
On startup, Charlotte opens a URLS.DAT file and reads in the user-configurable initialization information, including the location of the NETSCAPE.EXE file, time measurement limits, and other flags (as detailed later in this AppNote). Charlotte then loads Netscape and clears Netscape's local browser cache if the CLEAR_CACHE_FLAG is set to "yes."
After this initialization process, Charlotte uses Netscape's browser to sequentially load each of the URLs specified in the URLS.DAT file. Each time Charlotte initiates an "open" request for a URL, a timer is started. Charlotte then watches Netscape Navigator's status bar, located in the lower portion of the window, for a "Document: Done" message (see Figure 1).
Figure 1: Netscape Navigator displays a "Done" message in its status line when the URL is completely loaded and rendered.
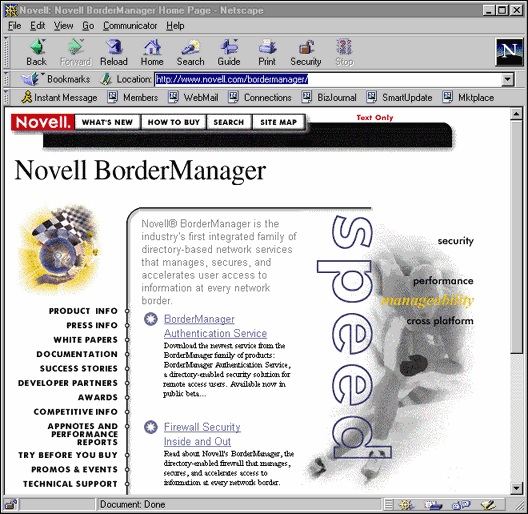
At this time, Charlotte stops the timer and records the total time in the CHARLOTT.LOG file. The time measurements are reported in seconds, with an accuracy of +/ 1 millisecond.
Charlotte works well with almost all URLs, including those that are Java-enabled. However, some Web pages incorporate Java applets with endless loops. Since these pages continuously display an "Applet . . . running" message in the status line (see Figure 2), they never allow Navigator to return a "Document: Done" message to the status bar.
Figure 2: Netscape Navigator continuously displays an "Applet running" message after a Java-enabled page is completely loaded and rendered.
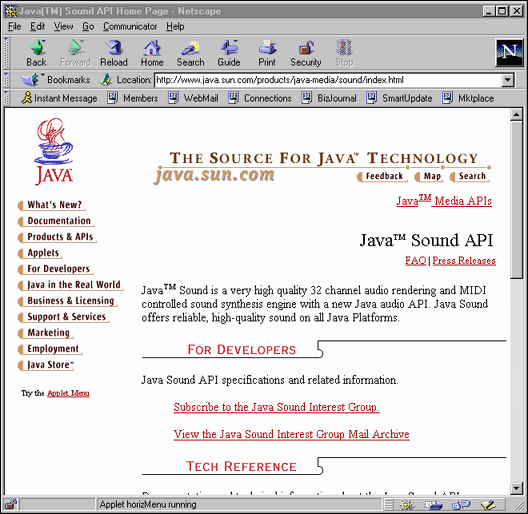
Because Charlotte is unable to determine when such pages are completely loaded, these sites time out and Charlotte records a time-out error ("Failed") in the log file. If you encounter such sites when using Charlotte, you should remove the corresponding URLs from your URLS.DAT file and focus your measurements on other sites that do not incorporate Java applets with endless loops.
Note: There are other possible causes of the "Failed" result being returned by Charlotte. These are discussed in the Troubleshooting section of this AppNote.
Charlotte Installation, Setup, and Troubleshooting
To run Charlotte on a network workstation, you'll need Netscape Navigator 4.x and a TCP/IP connection to one or more intranet or Internet Web sites. You can download Navigator 4.x from Netscape's Web site at
Step 1: Obtain the Charlotte WINZIP file and extract its contents.
First, you need to download the Charlotte WINZIP file and extract its contents into the Charlotte program directory of your choice on the workstation. The self-extracting file is named CHARZIP.EXE file, and it can be downloaded from the following URL:
http://www.novell.com/products/bordermanager/appnotes.html
The contents of CHARZIP.EXE include five files:
CHARLOTT.EXE
AT3032B5.DLL
CW3220MT.DLL
HK3032M.DLL
URLS.DAT
A sixth file, CHARLOTT.LOG, is created during each test run. You should rename and save this file after each test if you want to reference the results from previous tests. Otherwise, CHARLOTT.LOG is overwritten with each test.
Note: You can specify alternate log file names when starting Charlotte by adding the "/log=<filename<" option. For example, your command line could include
CHARLOTT /log=filename.log
where filename.log is a name of your choice.
Step 2: Configure Charlotte with the URLS.DAT file.
Next, you can configure Charlotte for your particular situation by editing the sample URLS.DAT file that comes with the utility. The table below lists the parameters you may need to modify. The examples provided in the table indicate the recommended default for each parameter.
|
Parameter |
Description |
Example (Recommended Default) |
|
PATH_TO_NETSCAPE |
This parameter is set to Netscape's defaultinstallation path. If you have installed Netscape in a different location, this is where you tell Charlotte how to find it. |
C:\\Progra~1\\Netscape\\Communicator\\Program\\netscape.exe (Note: Double slashes "\\" are required for the path separator.) |
|
MAX_PAGE_LOAD_TIME |
The maximum time (in seconds) to wait for a page to finish loading, once it has started, before aborting and proceeding with the next page. If you have slow network access you may need to increase these values to avoid page load time out failures. (Caution: Leave these values the same for all test runs, to avoid skewing results. If you must change the default values, experiment to find values that work, and use those values for all test runs.) |
MAX_PAGE_LOAD_TIME "10" |
|
ITERATIONS |
The number of times Charlotte will clear the cache and load each of the Web pages you have listed. |
ITERATIONS "1" |
|
CLEAR_CACHE_FLAG |
If you would like Charlotte to clearNetscape's cache before beginning, leavethis field set to "yes". |
CLEAR_CACHE_FLAG "Yes" |
|
RELOAD_NETSCAPE_FLAG |
If you would like Charlotte to unload andthen reload Netscape before eachiteration through the URLs, set thisparameter to "yes". The default value is"no". |
RELOAD_NETSCAPE_FLAG "No" |
|
RELOAD_NETSCAPE_DELAY |
This field specifies the time (in seconds)Charlotte is to wait after unloadingNetscape before trying to start it up again. |
RELOAD_NETSCAPE_DELAY "10" |
|
DELAY_BETWEEN_PAGES |
Set the delay (in seconds) Charlotte is toimpose between URL requests. |
DELAY_BETWEEN_PAGES "2" |
Step 3: Add URLS to configure the workload.
At the end of the URLS.DAT file is a list of URLs for Charlotte to request. Replace the sample list of Web pages with those you would like to test. The required format is as follows: Each URL must be on a separate line, and must be preceded by the key word WEB_PAGE. Each URL must be enclosed in quotes.
For example:
WEB_PAGE "http://www.novell.com/products/bordermanager" WEB_PAGE "http://www.hertz.com" WEB_PAGE "http://www.amazon.com" WEB_PAGE "http://www.landsend.com" WEB_PAGE "http://www.mit.edu" WEB_PAGE "http://www.excite.com" WEB_PAGE "http://www.pcweek.com" WEB_PAGE "http://www.intel.com"
Step 4: Execute CHARLOTT.EXE.
Charlotte is a Windows application that is compatible with Windows 95 or Windows NT. Start the program as you would any other Windows program.
Troubleshooting Tips
Charlotte has been programmed to recognize and handle the most common error messages displayed by Netscape. As Charlotte runs, you may see Netscape Error Dialogs (such as "Netscape is unable to locate the server . . .") momentarily appear on the screen. This is no cause for concern. It simply indicates that Charlotte is hard at work, doing its best to catch error messages and log failures for errors that occur at key points during the test.
However, Charlotte cannot handle all possible states of Netscape's user interface. If Charlotte encounters a user interface condition it does not know how to handle, you will typically see an error message dialog with the title "AppTester Message" (usually with the words "Error: Context not found" at the bottom of that dialog). The only option at this point is to click "OK", which will shut down Charlotte. Before restarting the test, review the troubleshooting tips outlined below.
Charlotte or Netscape Won't Load. If Charlotte doesn't load Netscape Navigator correctly, try the following solutions:
Verify that you have Netscape Navigator version 4.04 correctly installed on the workstation.
Verify that you can run Netscape successfully without the Charlotte utility.
Verify that you have completed any initial Netscape setup requirements (such as user profiles and so on). There should not be any dialogs requesting information when Netscape is started.
Verify that the PATH_TO_NETSCAPE in the URLS.DAT file is where Netscape is installed on your machine.
Note: If you need to change the path, be certain all path separators "\" are replaced with "\\".
Fatal Error in Netscape. If Charlotte produces a fatal error in Netscape, there may be a hardware or software conflict. Your best bet is to try running Charlotte on a different workstation.
"Failed" Result. If an individual URL reports its result as "Failed" in the CHARLOTT.LOG file, follow the procedure below to identify the cause of the error.
From your browser, open the "Failed" URL and watch the status bar in the lower left hand corner.
If the URL executes a Java applet in an endless loop, a "Done" status will never appear on the status bar and Charlotte cannot determine when the browser finished loading the URL. URLs that fit this description should be left out of Charlotte's URL.DAT script if you want to avoid the "Failed" result.
If the browser eventually loads the URL and displays a "Done" status on the status bar, Charlotte's timers may be set too low. This could be the case for slow sites as well as all sites accessed via a slow link. Increase Charlotte's MAX_PAGE_LOAD_START and MAX_PAGE_LOAD_TIME settings to allow more time for URLs to load without generating a "Failed" status.
Inaccurate Results. If your results aren't what you expected, you may have forgotten to clear the browser's cache prior to one of the test runs. To validate your results, rerun your tests, being careful to clear the browser and proxy caches at the appropriate times.
Invalid or inaccurate results can also be produced by moving your mouse over the test window or allowing the mouse to idle in the test window. Under these circumstances, your mouse will invariably cause hypertext references to display on the browser's status line and eliminate the "Document: Done" indicator used by Charlotte to time the URL event. When running Charlotte, make sure that you don't position the mouse over the Netscape window.
Using Charlotte to Measure Web Response Times
After installing and configuring Charlotte on an Internet-enabled workstation, you can begin using it to measure Web performance in your network environment. However, as this process can involve some unexpected phenomena, we recommend that you begin with several simple tests to build your confidence. Once you're comfortable with Charlotte's abilities, the majority of your work will take the form of measuring response times before and after you alter your Internet or intranet infrastructure.
As you run before-and-after tests with Charlotte, keep in mind that every component in the system has an impact on performance. You must be careful to identify exactly what you're measuring. For instance, if you have made a change to your Internet or intranet infrastructure and forget to clear the local browser cache before running Charlotte, the results of your test will reflect the performance of the browser's cache rather than the change in the network infrastructure.
Caution: Local browser caches inevitably affect Charlotte's measurements. Pay close attention to the instructions given below on clearing your browser's cache.
We recommend that you start with a series of tests designed to measure the performance benefits of a local browser cache, as described in the section on "Measuring Browser Cache Performance" below. Try running the test with several different configurations to become accustomed to the impact of the various changes. Once you have experimented with different URLs and you are accustomed to the variability of Internet response times, you'll be ready to move up to the next level: measuring the impact of proxy caches and Web server accelerators.
Measuring Browser Cache Performance
This exercise demonstrates how to measure the response-time performance of your client browser with and without a local browser cache.
Test 1 - No URL Content in Local Browser Cache
In this test, we will configure Charlotte to measure the response time for each of the selected URLs without the benefit of previously-cached content in the browser's memory and disk cache. This configuration is illustrated in Figure 3.
Figure 3: Browser test configuration with the browser memory and disk caches automatically cleared by Charlotte.
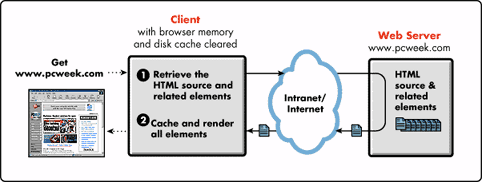
Configure Charlotte to clear the browser's cache prior to each measurement series by setting the CLEAR_CACHE_FLAG parameter to "yes" in the URLS.DAT file. Although the requested Web content is cached by the browser as it is rendered, these initial requests to the origin Web server don't reap the benefit of local caching.
Run Charlotte.
If you didn't specify a unique log file name at the command line, rename and save the resulting CHARLOTT.LOG file for future reference.
Figure 4 shows some example results we obtained when running such a test.
Figure 4: Example Charlotte log file showing test results with the browser cache cleared.
http://www.novell.com/products/bordermanager 1.192

   http://www.hertz.com 7.801

   http://www.amazon.com 2.444

   http://www.landsend.com 4.677

   http://www.mit.edu 1.202

   http://www.excite.com 2.273

   http://www.pcweek.com 5.999

   http://www.intel.com 3.325

   -------- Summary: --------

   Average Load Time: 3.614 sec

   Total Pages: 8

   Successful Pages: 8

   Failed Pages: 0
At the end of each URL line in the log file is the elapsed time, in seconds, between the time the browser opened the URL and the time the browser finished rendering the page and all of its associated elements. The summary given at the bottom of the file shows that all eight Web pages were loaded successfully, with an average load time of 3.614 seconds.
Notice that while all of the URLs loaded within 10 seconds of each initial request, the sites at www.hertz.com and www.pcweek.com took significantly longer to load. If you reran the test and collected a trace of the network traffic with a network analyzer such as Novell's LANalyzer, you would see that these high measurements had two separate causes. The Hertz measurement simply incurred a momentary delay. This could have been cause by a surge of traffic on the Internet between the browser and Hertz Web site, or a busy Web server.
On the other hand, the PC Week home pages are "heavier" than the others, meaning the site requires the browser to request a considerable number of additional elements before the browser can fully render the page. In this case, the browser is incurring the penalty of up to 40 additional requests to the Web server, as well as variable response times on all those request-response hops through the Internet.
Test 2 - Verification of Non-Cached Test Results
To get a feel for the response-time differences that can occur from test to test, rerun the test with Charlotte again automatically clearing the browser's memory and disk cache. If you configured Charlotte to automatically clear the browser's cache, these test results should be similar to those in Figure 4. Figure 5 shows the results of this second test.
Figure 5: A second set of Charlotte results with the browser cache cleared.
http://www.novell.com/products/bordermanager 1.322

   http://www.hertz.com 2.264

   http://www.amazon.com 3.355

   http://www.landsend.com 5.508

   http://www.mit.edu 1.172

   http://www.excite.com 2.353

   http://www.pcweek.com 7.391

   http://www.intel.com 6.660

   -------- Summary: --------

   Average Load Time: 3.753 sec

   Total Pages: 8

   Successful Pages: 8

   Failed Pages: 0
Notice that the Hertz response-time has dropped dramatically, validating our point that the first measurement in Test 1 was a one-time anomaly. However, the PC Week response time remained high due to the "weight" of the page.
In addition, several of the results--including PC Week-- are nearly a full second faster or slower than in the first set of results. All of these differences are caused by variations in Internet performance that are beyond your control. You can nearly eliminate these differences by setting up your Charlotte tests in an isolated lab environment with no other traffic besides that generated by the test itself. However, if you want to measure real-world response times with URLs that represent your user community's most common Web activities, you'll have to perform enough tests that you can average your results and define an acceptable margin of error.
Test 3 - URL Contents in Local Browser Cache
Once you have a good feel for the expected deviations in Charlotte's test results, you can rerun the test, this time with the browser's memory and disk cache populated with the Web content from the previous tests. Edit the URLS.DAT file and set the CLEAR_CACHE_FLAG = "no" and rerun the test. Thus, in this run, the cacheable Web content from the previous test will still be stored in Netscape's memory and disk cache. This configuration is illustrated in Figure 6.
Figure 6: Browser test configuration with some of the Web elements cached in browser memory and disk caches.
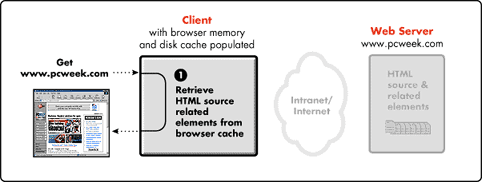
Reconfigure Charlotte to leave the Web content from the previous tests in browser cache (set the CLEAR_CACHE_FLAG parameter to "no").
Run Charlotte again. The results should show a significant performance improvement over the previous non-cached tests.
Rerun the test several times to make sure your results are repeatable (remembering to rename the log file each time). Then average the results from all the tests to allow for variations in Internet performance.
Comparing the before-and-after results demonstrates the value of browser cache configuration. Figure 7 shows our example results with a populated browser cache.
Figure 7: Charlotte results with the browser cache populated.
http://www.novell.com/products/bordermanager 1.412

   http://www.hertz.com 1.262

   http://www.amazon.com 2.473

   http://www.landsend.com 3.394

   http://www.mit.edu 1.201

   http://www.excite.com 2.243

   http://www.pcweek.com 5.858

   http://www.intel.com 2.313

   -------- Summary: --------

   Average Load Time: 2.520 sec

   Total Pages: 8

   Successful Pages: 8

   Failed Pages: 0
A first-glance comparison of the results in Figure 5 and Figure 7 would seem to indicate that the browser cache was able to reduce the average load time for these pages from 3.753 seconds to 2.52 seconds. This represents an average response time improvement of 1.233 seconds, or a 33% increase in overall performance.
You should rerun this "cached" test as described below, to make sure your results are repeatable.
Test 4 - Verification of Cached Test Results
Figure 8 is a rerun of the Charlotte results in Figure 7. In this test we left Charlotte configured the same way as in Test 3 so that the browser cache remained populated with previously-accessed Web content.
Figure 8: A second set of Charlotte results with the browser cache populated.
http://www.novell.com/products/bordermanager 2.333

   http://www.hertz.com 1.172

   http://www.amazon.com 2.584

   http://www.landsend.com 2.464

   http://www.mit.edu 1.172

   http://www.excite.com 4.937

   http://www.pcweek.com 7.641

   http://www.intel.com 2.344

   -------- Summary: --------

   Average Load Time: 3.081 sec

   Total Pages: 8

   Successful Pages: 8

   Failed Pages: 0
As you can see, our initial performance improvement due to browser caching degraded somewhat in this subsequent test run. These results demonstrate the importance of running several Charlotte tests before drawing any conclusions.
Now that you've had some experience with Charlotte in measuring the benefits of local browser caching, you're better prepared to measure the benefits of introducing shared network services such as proxy caching and Web server acceleration. These services operate in much the same way as the local browser cache in that they cache previously-requested Internet objects in memory or on disk. The difference is that these caches are shared by the entire user community in a networked environment.
Measuring Proxy Cache Performance
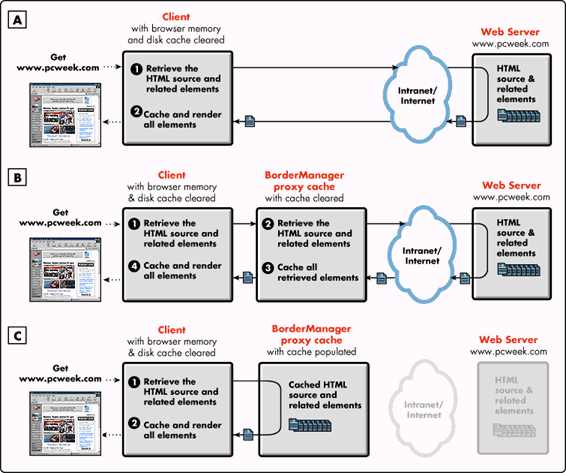
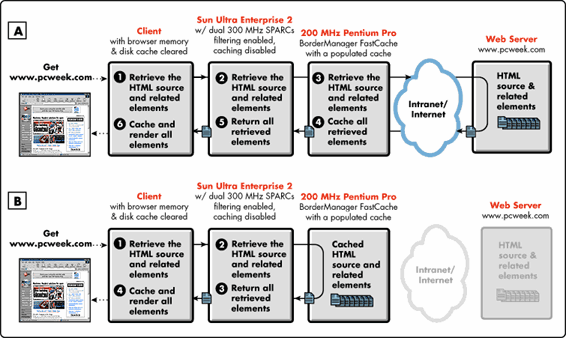
This section describes how to measure the performance of an Internet connection with and without a proxy cache. During this series of tests, we show you how to produce before-and-after measurements that demonstrate the value of proxy caching. The three test configurations for these measurements are illustrated in Figure 9.
Figure 9: Proxy cache test configurations.
Test 1 - No Proxy or Proxy Cache
We will begin by running Charlotte to determine end-user performance without the proxy cache installed (see Figure 9A).
Configure Charlotte to clear the browser's cache before each measurement (set the CLEAR_CACHE_FLAG parameter to "yes").
Remove the proxy cache from the configuration
Run Charlotte several times to make sure your results are repeatable.
Average the results from the test series to allow for variations in Internet performance.
The accuracy of your results and their repeatability will vary because Charlotte is generating requests that traverse the Internet where variable traffic rates and delays are constantly occurring.
Test 2 - Empty Proxy Cache
Once you've gotten a feel for end-user performance without a proxy cache, you're ready to run the test again with the proxy cache installed (see Figure 9B).
Install the proxy cache.
Clear both the local browser cache and the proxy cache. Charlotte automatically clears the browser's cache when the CLEAR_CACHE_FLAG parameter is set to "yes." The BorderManager Proxy Cache can be cleared by unloading PROXY.NLM and reloading it with the "-CC" command line parameter as shown below: LOAD PROXY.NLM -CC
Run Charlotte once to populate your proxy cache. The results of this initial run measures the performance of the proxy during the fill process from the origin Web server, as well as the effect of cache misses.
Test 3 - Proxy Cache Populated with Popular Web Content
Rerun the test without clearing the proxy cache. These results measure the performance of the proxy during cache hits (see Figure 9C).
In the section "Case Study: Charlotte Shows Superiority of BorderManager FastCache at UtahLINK" below, we provide several real-world proxy cache measurements that were used to optimize an Internet infrastructure for an 87,000-seat ISP.
Measuring Web Server Accelerator Performance
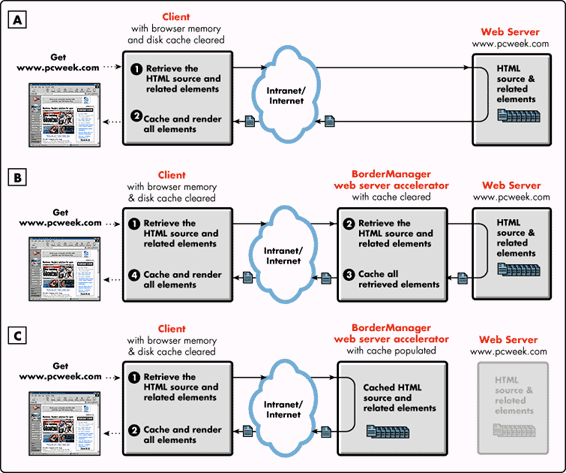
This section describes how to measure the performance of a Web server with and without a Web server accelerator (also known as "reverse proxy"). During this series of tests, we show you how to produce before-and-after measurements that demonstrate the value of Web server acceleration. The three test configurations for these measurements are illustrated in Figure 10.
Figure 10: Web server acceleration test configurations.
Test 1 - No Web Server Acceleration
We begin by running Charlotte to determine end-user performance without the Web server accelerator installed (see Figure 10A).
Configure Charlotte to clear the browser's cache before each measurement (set the CLEAR_CACHE_FLAG parameter to "yes").
Remove the accelerator from the Web server configuration.
Run Charlotte several times to make sure your results are repeatable.
Average the results from the entire test series to allow for variations in Internet or intranet performance.
Your results will vary slightly from test to test because the Web server's workload and ability to respond to requests are constantly changing. If you're using an idle Web server, you won't see as much variance in the performance results.
Test 2 - Web Server Acceleration with No Web Content Cached
Once you've gotten a feel for end-user performance of your Web server, you're ready to try the test again with the Web server accelerator installed (see Figure 10B).
Install the Web server accelerator.
Clear both your local browser cache and the proxy cache (LOAD PROXY.NLM -CC).
Run Charlotte once to populate your accelerator's cache.
The results of this initial run measure the performance of the accelerator while it is filling its cache with your site's most popular content. There will be a number of initial cache misses this first time. However, with Web server acceleration, the cache hit rate climbs quickly into the high 90-percent range. Because your user community's most requested content is a small subset of your Web server's data set, a 98% cache hit rate on the Web server accelerator is typical. Your goal is to measure the performance of the accelerator during its normal operation state, after its cache is populated, in the next test.
Test 3 - Web Server Acceleration with Most Popular Content Cached
Rerun Charlotte with the Web server accelerator populated (see Figure 10C).
These results measure the response-time performance of the accelerator for cache hits with your most popular Web content cached and represent the performance of accelerated Web content during its normal operating state.
Case Study: Charlotte Shows Superiority of BorderManager FastCache at UtahLINK
In late 1997, Novell participated with UtahLINK, a local Internet Service Provider serving 400,000 users, in a pilot to demonstrate the advantages of using BorderManager's FastCache proxy cache capabilities. These tests demonstrated performance with FastCache ranging from 2 to 100 times faster than the performance of a client not having the advantage of BorderManager's proxy cache. (For more details on this real-world demonstration, see http://www.novell.com/products/bordermanager/utahlink.html.)
Additional tests demonstrated BorderManager's performance advantage of nearly two times the performance of a competing caching solution from Network Appliance.
Figure 11 illustrates the UtahLINK production network prior to the Charlotte testing.
Figure 11: The UtahLINK production network prior to the installation of BorderManager.
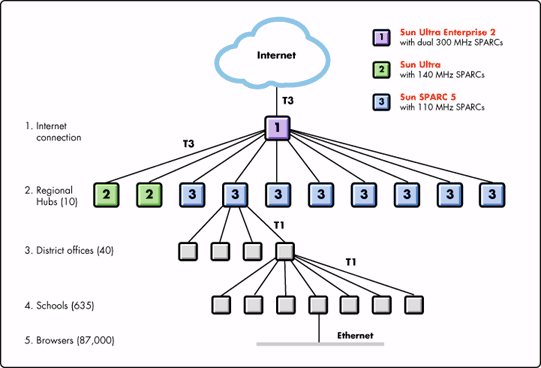
UtahLINK's state-wide WAN connects 87,000 seats through a series of 40 district offices and on to a centralized ISP facility with a T3 line to the Internet. UtahLINK originally purchased the Sun equipment to provide content filtering and proxy caching for the state's 400,000 students. However, when content filtering used up the Sun resources, caching was disabled to devote the Sun systems to the filtering workload.
By the fall of '97, the UtahLINK system was successfully filtering Internet content but was quickly running out of WAN and server bandwidth. From the beginning of school in September '97 to May '98, Internet usage increased from 15 million hits per month to 55 million hits per month. Complaints included very slow download times for all URLs, the near impossibility of having a teacher-led study group use the Internet together, and dismal times-on-task.
Since then, UtahLINK has successfully piloted a BorderManager solution involving a single 200MHz Intel Pentium Pro system. They now use three BorderManager Proxy Cache's configured in a service cluster running on Compaq ProLiant 850R computers, as illustrated in Figure 12.
Figure 12: UtahLINK's current solution employs a cluster of BorderManager servers.
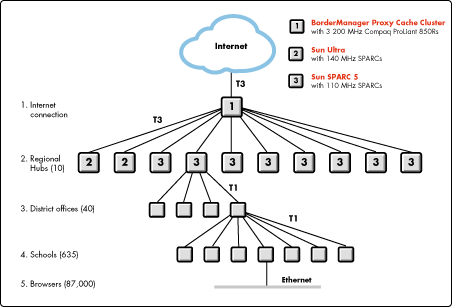
This clustered arrangement allows all three proxy caches to split the burgeoning workload three ways and provides automatic fail-over of the proxy cache service in case one or more of the systems fail.
BorderManager and Unix-Based Proxy Server Measurements
At the outset of the UtahLINK BorderManager pilot, some of UtahLINK's customers were wary of caching and its value. This section describes a series of Charlotte measurements UtahLINK produced to demonstrate the value of caching to their constituency.
For this first series of tests, UtahLINK set up the test configurations shown in Figure 13.
Figure 13: Test configuration at UtahLINK.
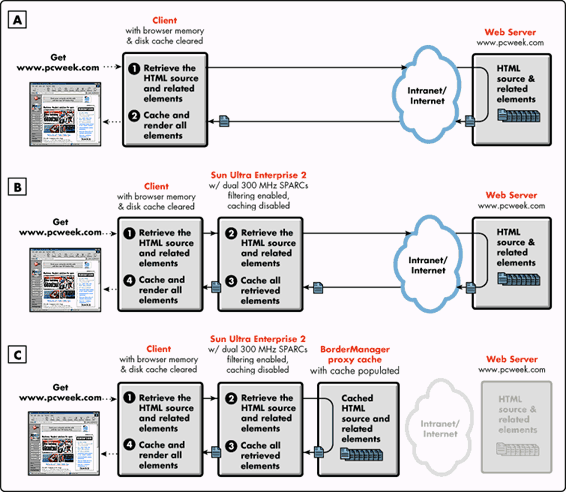
The first test was run using no proxy servers (see Figure 13A). The second test added a Unix-based proxy server (the particular proxy server used does no caching; it's acting solely as a content filter for the client browsers) illustrated in Figure 13B. For the third test, the browser used the Unix-based proxy, and BorderManager running on a 200MHz Pentium Pro system configured as a proxy cache (see Figure 13C).
Before starting, the network manager ran Charlotte once with BorderManager FastCache installed to make sure that proxy cache was populated. The memory and disk cache on the browser was cleared before each test to minimize the effects of local browser caching. Figure 14 compares the results for the three tests. (Any URL that resulted in a "Failed" error was removed from this data set.)
Figure 14: Comparison of UtahLINK test results with and without BorderManager FastCache.
|
URL |
None |
Proxy |
Proxy + Border |
|
http://www.novell.com |
8.152 |
12.768 |
11.977 |
|
http://www.novell.com/products/bordermanager |
3.515 |
9.394 |
8.012 |
|
http://www.greatbooks.com |
7.391 |
2.894 |
1.652 |
|
http://www.netscape.com |
3.064 |
2.964 |
2.974 |
|
http://www.geocities.com |
3.084 |
4.316 |
2.874 |
|
http://www.uen.org |
1.633 |
3.035 |
2.995 |
|
http://www.infoseek.com |
5.628 |
8.542 |
3.245 |
|
http://www.excite.com |
2.513 |
2.523 |
2.924 |
|
http://www.novell.com |
4.897 |
17.465 |
8.953 |
|
http://www.yahoo.com |
5.027 |
2.624 |
1.332 |
|
http://www.sltrib.com |
4.105 |
4.557 |
4.486 |
|
http://www.nba.com |
5.458 |
5.768 |
5.698 |
|
http://www.granite.k12.ut.us |
1.673 |
3.385 |
1.672 |
|
http://ad.doubleclick.net |
1.292 |
1.272 |
1.281 |
|
http://www.desnews.com |
5.288 |
6.329 |
7.010 |
|
http://www.usatoday.com |
8.622 |
18.957 |
7.601 |
|
http://www.yimg.com |
1.332 |
3.915 |
1.312 |
|
http://www.lycos.com |
6.449 |
5.388 |
2.323 |
|
http://www.mtv.com |
3.065 |
3.555 |
3.094 |
|
http://www.disney.com |
1.553 |
16.243 |
3.365 |
|
http://www.webcrawler.com |
5.228 |
10.324 |
1.843 |
|
http://search.yahoo.com |
2.384 |
7.070 |
1.261 |
|
http://webcrawler.com |
1.653 |
2.744 |
1.632 |
|
http:www.nintendo.com |
19.037 |
29.833 |
2.043 |
|
http://my.excite.com |
3.284 |
3.245 |
3.094 |
|
http://www.claus.com |
81.407 |
26.568 |
3.645 |
|
http://www.microsoft.com |
1.272 |
5.708 |
4.196 |
|
http://www.ksl.com |
18.466 |
12.158 |
3.835 |
|
http://www.whitehouse.gov |
16.233 |
38.455 |
3.104 |
|
http://edit.my.yahoo.com |
0.681 |
2.383 |
2.494 |
|
http://www.pathfinder.com |
25.927 |
23.984 |
8.693 |
|
http://ads.lycos.com |
2.784 |
3.625 |
2.333 |
|
http://www.altavista.digital.com |
4.337 |
2.855 |
2.884 |
|
http://cybertown2.wman.com |
1.302 |
1.292 |
0.241 |
|
http://ad.linkexchange.com |
1.292 |
0.210 |
0.221 |
|
http://guide.netscape.com |
2.003 |
5.708 |
1.833 |
|
http://www.n64.com |
2.954 |
1.883 |
1.643 |
|
http://www.iconbazaar.com |
30.894 |
13.971 |
6.189 |
|
http://www.pca.state.mn.us |
7.420 |
7.942 |
4.066 |
|
http://www.corel.com |
4.266 |
8.564 |
6.920 |
|
http://www.cbs.com |
10.696 |
21.581 |
13.179 |
|
http://www.cdnow.com |
9.974 |
21.911 |
8.933 |
|
http://www.globalearn.org |
16.554 |
40.528 |
3.135 |
|
AVERAGE TIMES |
8.230 |
9.990 |
4.000 |
The average results from these tests are summarized in Figure 15.
Figure 15: Average results from the first series of UtahLINK tests (lower numbers are faster).
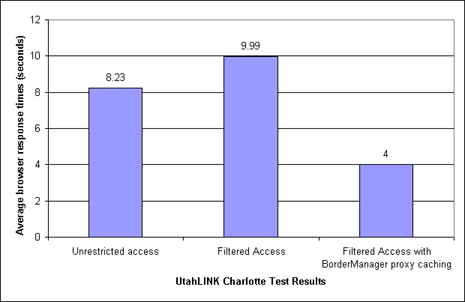
This chart shows how BorderManager FastCache dramatically increased the performance of UtahLINK's Internet infrastructure. The first bar represents the average response time for UtahLINK's Internet requests with unrestricted access. The second bar shows a 21% loss of performance with the introduction of content filtering. The third bar is UtahLINK's current average response time with BorderManager installed. BorderManager's strength as a cache not only compensates for UtahLINK's content filtering overhead but also cuts their original response times in half. This is good news for those customers who were concerned that using a proxy cache in addition to a content filtering proxy would have a negative effect on Web response time.
Using Charlotte and several other measurement methods, the network manager at UtahLINK documented the following values:
Response time improvements ranging from 2 to 100 times
Increased time-on-task for teacher-led Internet study groups and labs
Reduced bandwidth consumption
Now that the word is out, the state's nine universities and colleges are clamoring to get in on UtahLINK's cached Internet access. With 30GB of cache, and over 1.5 million recently-used Web objects, UtahLINK's BorderManager is handling 75% of the state's public school's Internet requests. That's a valuable shared resource!
BorderManager FastCache vs. Network Appliance NetCache
The second series of tests was designed to compare performance of BorderManager FastCache vs. NetCache, a popular caching product from Network Appliance. This was essentially a David vs. Goliath test, pitting NetCache running on a Unix-based Alpha 533MHz computer (a very expensive system) against BorderManager running on a standard Intel Pentium Pro 200MHz NetWare server.
For this competitive series of tests, UtahLINK set up the test configurations shown in Figures 16, 17, and 18.
Figure 16: Test configurations at UtahLINK.
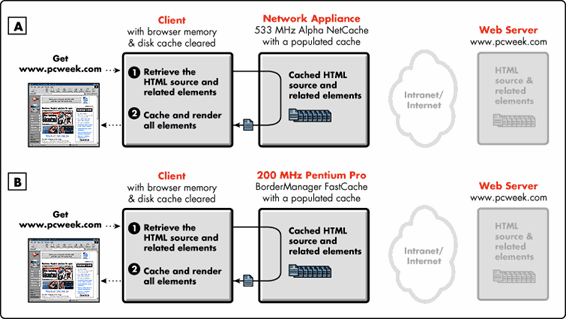
Figure 17: Test configurations at UtahLINK.
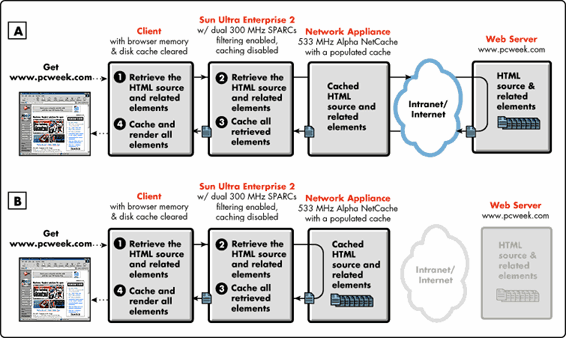
Figure 18: Test configurations at UtahLINK.
Before each test, the local memory/disk cache was cleared to minimize the effects of browser caching. The average results of these tests are summarized in Figures 19 and 20.
Figure 19: Average results from the second series of UtahLINK tests (lower numbers are faster).
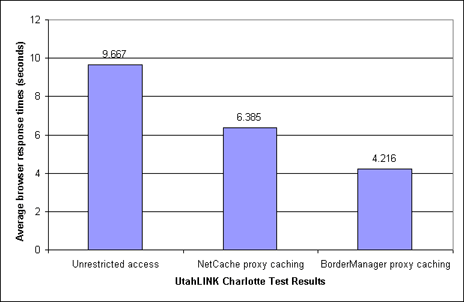
Both charts show how BorderManager FastCache outperformed the competition. In Figure 19, a debug version of BorderManager running on a 200MHz Pentium Pro server showed a 33% increase in performance over the 533MHz Alpha-based Network Appliance NetCache product.
Figure 20: More results from the second series of UtahLINK tests (lower numbers are faster).
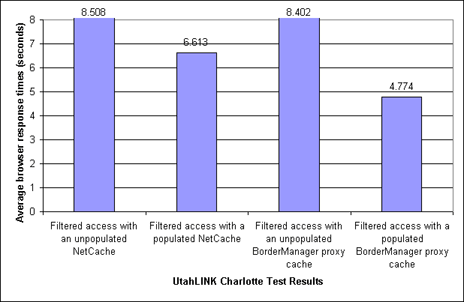
In Figure 20, the first and third bars show UtahLINK's response times to be comparable when requesting Web content that has not been previously cached (cache misses). The second and fourth bars provide a comparison of performance when the Web content has been cached and is actively being shared among UtahLINK's users.
Although UtahLINK was running a debug version of BorderManager FastCache that ran half as fast as the production version, BorderManager FastCache beat NetCache in two out of three direct comparisons, by as much as 33%.
Needless to say, several Unix fanatics who assisted with these tests gained a healthy respect for the capabilities of NetWare and BorderManager running on an inexpensive PC platform. Beyond a raw performance comparison, BorderManager's price-performance ratio is significantly more attractive than that of Network Appliance and other appliance solutions.
The bottom line for UtahLINK was that BorderManager is very fast, not only in comparison with their non-cached infrastructure, but also when compared to other high-cost caching products on the market. UtahLINK found the Charlotte results to be much more valuable than benchmark results because Charlotte used a real workload to measure real-world response times for their user-community's Internet access workload.
Conclusion
Charlotte is so easy to install and run that every BorderManager customer should have the benefit of a before-and-after performance measurement of their Web infrastructure. We encourage you to distribute this tool to anyone who can benefit from these types of measurements including customers who want to run performance tests between BorderManager and other competing cache products.
* Originally published in Novell AppNotes
Disclaimer
The origin of this information may be internal or external to Novell. While Novell makes all reasonable efforts to verify this information, Novell does not make explicit or implied claims to its validity.