Novell GroupWise Performance Management on Compaq Servers
Articles and Tips: article
Internet Solutions Engineering
Compaq Computer Corporation
01 Jun 1998
This AppNote is adapted from a Compaq White Paper published in September 1997, document number ECG007.0897. For more information, visit http://www.compaq.com.
Find out what Novell and Compaq engineers learned from a series of SuperLab tests about how to really soup up your GroupWise 5.2 Servers running on NetWare.
- Introduction
- Overview of GroupWise 5.2
- Performance Management
- Subsystem Performance Comparison
- Performance Tuning
- Performance Conclusions
- Conclusion
Introduction
This document provides the results of a performance analysis conducted by Novell and Compaq engineers on the GroupWise Server for Novell intraNetWare. The information is based on technical knowledge acquired by both Novell and Compaq engineers while testing these products in a closely controlled environment. This information is for system integrators and network administrators with knowledge of Compaq Server products, Novell GroupWise, and intraNetWare. It is a supplement to the "Compaq Hardware Reference" document and the Novell GroupWise 5.2 documentation.
One objective of this document is to provide information to assist current customers running Novell GroupWise 5.2 for intraNetWare on Compaq servers in optimally configuring their server(s) to achieve the highest possible performance from their hardware and software. Information is also provided that will assist customers in making configuration upgrade decisions that may be based on an anticipated return in performance gains.
Another objective is to provide information to assist future customers in selecting the appropriate server hardware configuration for their operating environment. Data provided illustrates performance and system utilization that can be expected for various processor types, server memory quantities, and disk subsystem choices. Customers may use this data to determine which price-for-performance configuration would best suit their business needs.
The results and conclusions of this paper provide:
An overview of how Novell GroupWise works.
A discussion of performance management, including the performance impact of various hardware configurations.
Suggestions for improving GroupWise Server for intraNetWare performance and recommendations for selecting the appropriate server hardware for your GroupWise Server.
Overview of GroupWise 5.2
The Internet has changed the face of business communications. While e-mail is fine for sending messages back and forth, in today's marketplace where survival often depends on your ability to collaborate and share information e-mail isn't enough. In order to work effectively, you need the tools to send and retrieve messages, access shared documents, store voice-mail messages and make appointments. Just as important, you need a tool that lets you get the information you need when and where you need it. With expanded Internet capabilities and an elegant, easy-to-use interface, GroupWise 5.2 is that tool.
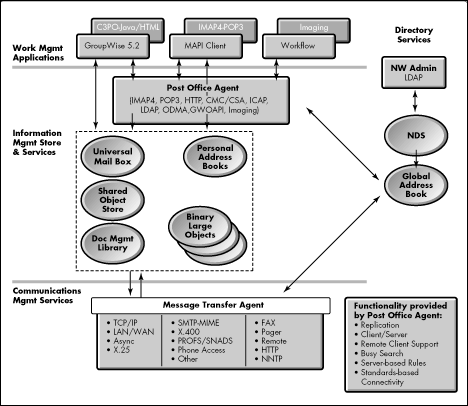
Figure 1 depicts the GroupWise 5.2 architecture.
Figure 1: GroupWise 5.2 architecture.
Functionality of GroupWise 5.2 Server
The GroupWise 5.2 Server provides the following features and services:
Full-featured e-mail
Document management
Calendaring and scheduling
Workflow
Imaging
Remote Access
Conferencing
Paging
Forms
Voice mail integration
Faxing capabilities
Intranet/Internet integration
and more . . .
GroupWise System Requirements
Following are the recommended hardware and software requirements for GroupWise 5.2 clients.
|
Client |
Processor |
Memory |
Hard Disk Space |
|
Windows 95 or NT 4.0 |
486/33 or higher |
16 MB (Windows 95)24 MB (Windows NT) |
4 MB (Workstation)24 MB (Full install) |
|
Windows 3.1 |
486/25 or higher |
8 MB |
2 MB (Workstation)20 MB (Full install) |
Server Agents are available for:
NetWare 3.1x or intraNetWare/NetWare 4.x (NLM version)
Windows NT 3.51 or higher (Novell Directory Services aware)
Performance Management
Performance management can be successfully achieved only by fully understanding the performance impact that system resources (such as the system processor, memory, and disk subsystem components) have on the overall operation of your entire system. Changing the configuration of these components affects performance in many ways. The goal of this section is to help customers understand the relationship between system resources and GroupWise Server performance. With this understanding, customers may make decisions regarding changes to an existing server configuration as well as complete configuration of a new installation.
This section:
Defines two perceptions of performance.
Describes performance analysis.
Discusses standard and customized benchmarks as a performance measuring tool.
Describes the testing methodology used during the study while focusing on Novell NetBench as the benchmark tool used for measuring performance of the CPU, memory, and disk subsystem.
Data gathered from Novell NetBench testing is presented and configuration recommendations are provided based upon data analysis and the experience of Novell and Compaq engineers.
Performance Characteristics
Performance can be viewed in one of two ways. To a system administrator, performance means effective management of system resources. A system administrator's concerns are system throughput and utilization. To an end user, however, performance is measured by system response time. In practice, it is necessary to balance the two perspectives; understanding that a change made to improve response time may require more system resources.
The purpose of this section is to provide the customer with an understanding of how the GroupWise Server performed under various test configuration scenarios or benchmarks. Based on results from these tests, information is provided that can be used as a guideline for gauging the response time, throughput, and capacity expected of Novell GroupWise running on a Compaq server.
Performance Analysis
Performance analysis is an ongoing, interactive process necessary for determining whether or not your server is performing as it should. Performance analysis that is required as a part of performance management includes:
Understanding your user requirements
Monitoring your server and network load patterns
Making appropriate modifications to your configuration to achieve optimal use of resources
For the performance analysis investigation, Novell and Compaq engineers used a standard benchmark tool to examine the following GroupWise Server system resource areas:
System processor (CPU)
Memory
Disk subsystem
Bus architecture (PCI versus EISA)
File systems
Networking
Standard Benchmark Tool
A standard benchmark tool provides the ability to run the same test scenario under various operating environments to allow the comparison of one environment to another. For example, Test A executes a test script that initiates the execution of a fixed set of database or file operations for a consistent period of time on a hardware configuration, followed by the identical Test A running on another hardware configuration. The hardware configuration change implies that the processor, total system memory, network card, or disk subsystem configuration has been changed. To accurately measure the affect of configuration changes to one of these subsystems, all other variables are held constant except for the variable under test.
Customized Benchmark Tool
A customized benchmark is simply an extension of the standard benchmark tool. The customized benchmark provides the capability for test engineers to choose the type of workload from a number of provided profiles that most closely matches their real-world operating environment. Thus, one engineer's test results with a customized set of profiles should only be compared to other tests that used the same workloads. The output of the benchmark tools is raw data that must be analyzed before any conclusions can be made. The benchmark used in this test was developed by the Novell Engineering team. It has been customized to simulate the real-world workload.
|
Novell SuperLab The Novell SuperLab is an extensive testing facility available to internal Novell groups as well as third-party testing groups. The lab is unique in that it provides a scalable environment that enables testing groups to conduct large-scale tests resolving issues not encountered in typical lab environments. Resources include over 1700 computers, Symmetric Multi-Processor (SMP) resources, and telecommunications equipment. The testing is much more realistic with no simulation of connected users or desktops. For more information about the SuperLab, visit developer.novell.com/devres/slab. |
Test Configuration
Agent Configuration. The Post Office agent was configured using default settings, with the following exceptions:
The TCPTHREAD count was set to 30
The MFTHREAD count was set to 12
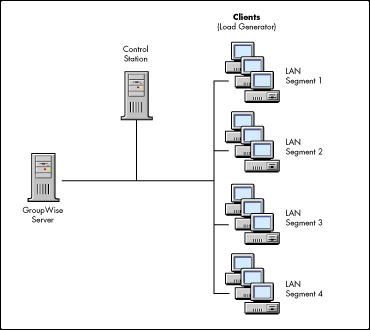
Hardware and Software Configuration. The hardware and software configuration used for the testing is listed below and illustrated in Figure 2.
|
Hardware System |
Compaq ProLiant 5000Compaq ProLiant 800 |
|
CPU |
200 MHz Pentium Pro (1 4) |
|
Memory |
128MB 1GB memory |
|
Disk |
Fast SCSI-2 and 8x2.1 GB Hard Disks |
|
Network |
NetFlex3 (1 4) |
|
Network OS |
intraNetWare 4.11 |
|
Application |
GroupWise 5.2 |
Figure 2: Testbed layout.
Test Procedure
Novell and Compaq engineers initially performed several trial runs to determine the best test duration and confirmation of steady state. Both test duration and steady state were determined using real-time monitor utilities from intraNetWare.
During the trial runs, engineers monitored the intraNetWare Performance Monitor and also logged the entire test process. For example, in the Network test, the team applied the same workload against four different LAN segments. In the first test, the team placed all 108 clients in one LAN segment and sent 20 mail items to 3 recipients. The team then separated the 108 clients into two LAN segments, with 54 clients each. Using the control station, the automated test scripts trigger the same tests.
The test data collected includes the following files:
The Post Office Agent Log
The STAT NLM output file
Response time
Subsystem Performance Comparison
This section offers guidelines for obtaining optimal value and performance from your Compaq server. These guidelines are based on tests designed by Novell and Compaq engineers. The tests are based on the analysis of the data gathered from NetBench testing. A description of each of the subsystems, the data collected from testing, and recommendations for the configuration of your Compaq server are included in this section.
The subsystems to be discussed are:
System processor (CPU)
Memory
Disk
Networking subsystem
System Processor (CPU)
In contrast to a resource-sharing (file server) environment, a faster processor for an implementation of GroupWise on an intraNetWare Server yields faster client response times. In a resource-sharing environment, the system processor plays a less important role in performance tuning than the memory, disk, and network interface card. For Novell GroupWise, however, the processor is the most important subsystem for high performance.
In the testing performed by the Novell and Compaq team, the performance of the Pentium processors was compared to that of the Pentium Pro processors. The type of processor and its associated architecture features have as much impact on performance as processor-rated clock speed. For example, the Pentium Pro processor offers outstanding performance that is partially attributed to the incorporation of the following dynamic execution features:
A superscalar architecture gives the processor the ability to execute multiple instructions per clock cycle.
Internal register renaming supports the execution of concurrent instructions.
Speculative execution of branches is supported via the processor's branch target buffer, which means the processor is able to predict the correct branch in most instances, thus increasing the number of instructions that can be executed out of order.
The processor fetches and decodes numerous instructions, which are then sent to an instruction pool that schedules instructions that have no dependencies on prior instructions to be executed even if the instruction is out of order.
Processor cache also has effect on performance. L1 cache(cache memory in the CPU itself) stores the most recent data and program instructions and provides this information to the server at the highest possible speeds. The system's L2 cache (near the CPU) has a 133 megahertz path to the CPU. L2 cache stores additional data and instructions. These two caches allow the CPU to function at higher rates of speed.
Information that is not stored in either L1 or L2 caches must come from the main system memory at a speed of 66 megahertz, in turn slowing down the CPU. In other words, the larger the L2 cache is, the better performance will be.
Memory
Memory is one of the most valuable resources in a Novell NetWare server. Memory is used for both disk cache as well as program execution. The detailed memory requirements for NetWare 4.1x servers can be found in "Optimizing IntranetWare 1 and 2 Server Memory" in the March 1997 issue of Novell AppNotes. In that calculation, the administrator needs to take a number of variables into consideration such as Total Disk Capacity, Total Number of Clients, Volume Block size, and so on.
GroupWise 5 Memory Requirements. These memory requirements are upper limits for a high-usage messaging system. The memory required on a server for GroupWise 5.2 varies depending on many factors. This document should not be used as an absolute tool for calculating memory requirements. A GroupWise system will run with less than the maximum amount of memory required, but performance will be increased with additional memory. Memory amounts stated are for GroupWise and not total system memory.
Factors that may cause variances in calculations and performance are:
Number of post offices and domains
Number of TCP Handlers and MF worker threads
Number of client/server connections being supported
Number of active client connections vs. idle connections
Message traffic between post offices and domains
Separate processors for POA, MTA, and ADA
Dedicated Client/Server and MF worker processors
IP or direct connections between MTAs
High volumes of administrative-related traffic (user adds/deletes, NDS synchronization, and so on)
High volumes of large messages (large attachments, remote updates, and so on)
Rule of Thumb for Memory Requirements. The largest amount of memory for GroupWise 5.2 is used while running the Post Office Agent (POA). The Message Transport Agent (MTA) and the Administrative Agent (ADA) have smaller requirements.
For the POA, three main groupings determine the memory requirements:
|
Base memory for code, data and quick finder: |
8,000,000 bytes |
|
Number of TCP handlers and MF workers: |
n x 2,000,000 bytes |
|
For C/S, number of concurrent connections: |
n x 50,000 bytes |
Recommended Memory Requirements. The table below outlines the memory requirements for post offices with 100, 250, 500, and 1000 users. The memory requirements reflect the POA, MTA, and ADA. The memory requirements reflect peak usage at a time when all users are active. (This information does not include requirements for the network operating system.)
|
Concurrent Users |
Machine Recommended |
Actual ServerMemory UsedDuring Peak Time |
|
100 active users and actual post office; 100 - 250 users |
Pentium 90 MHz |
42 MB |
|
250 active users and actual post office; 250 - 500 users |
Pentium 133 MHz |
104 MB |
|
500 active users and actual post office; 500 - 1000 users |
Pentium Pro 200 MHz |
116 MB |
|
1000 active users and actual post office; 1000 - 2500 Users |
Pentium Pro 200 MHz |
137 MB |
Disk
The disk subsystem has an impact on performance for all applications. The amount of I/O required by your application determines the degree of impact on the disk subsystem performance. Since Novell GroupWise is a very I/O-oriented application, the disk subsystem is an important contributor to overall system performance. Determining the impact of the disk subsystem involved analyzing the following options:
Volume block size
Drive spindles/striping (hardware striping versus software striping)
Fault tolerance (RAID 0, RAID 1, RAID 4, RAID 5)
Controller read/write ratio
Volume Block Size. The intraNetWare INSTALL program will set the default volume block size based on the size of the disk volume. Depending on the type of files stored on the volume, or the application you use, you can increase or decrease the volume block size to improve the performance.
The Novell/Compaq test team found that setting the volume block size to 64 KB yields the best result. The graph in Figure 3 shows the performance comparison.
Figure 3: Volume block size performance comparison.
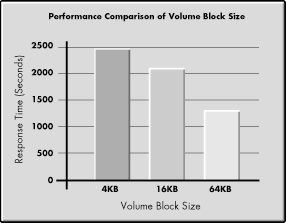
The test results show that there is a measurable difference in response time rates between various volume block sizes. A large volume block size will increase the performance by 100% from 64 KB over 16 KB. The large block size will also save a lot of memory to load the volume; therefore, we strongly recommend using the largest volume block size.
Drive Spindles/Striping. If your applications generate significant disk I/O, there will likely be a lot more concurrent use of system services. You can improve the performance of your disk subsystem under load conditions by having your hardware logical drive span multiple physical drives using "striping." Striping allows the data to be written "across" a series of physical drives that are viewed by the system as one logical drive. This data distribution across drives makes it possible to access data concurrently from multiple physical drives that have been defined as one logical drive array.
Performance gains are achieved when you read from or write to the drive after the series of physical drives is united into one or more logical drive arrays. By distributing or striping the data evenly across the drives, it is then possible to access data concurrently from multiple drives in the series or array. The concurrent access of the data leads to higher I/O rates for the drive arrays than the spindles, thus improving your total system performance.
The table below shows our drive spindle performance comparison with a mixed load.
|
Drive Configuration |
Response Time (Seconds) |
|
One drive |
823 |
|
8 drives with hardware striping (no fault tolerance) |
803 |
Fault Tolerance. Customers have several available options when configuring the GroupWise Server and making a decision about the level of fault tolerance the system requires. Redundant Arrays of Inexpensive Disks (RAID) is a term used to refer to an array technology that provides data redundancy to increase the overall system reliability and performance. The fault tolerance method the customer selects effects the amount of available disk storage and the performance of the drive array.
The following levels of fault tolerance support are available:
RAID 5 - Distributed Data Guarding
RAID 4 - Data Guarding
RAID 1 - Disk Mirroring
RAID 0 - No Fault Tolerance Support
The Compaq Smart-2 Array Controller is needed to support hardware striping and all levels of fault tolerance support. Features offered by the Compaq Smart-2 Controllers that are not found with Fast-Wide SCSI-2 Controllers are:
Support for RAID 0, RAID 1, RAID 4, and RAID 5 hardware striping and fault tolerance
Dual Fast-Wide SCSI-2 channels on a single board to support up to 14 drives (7 per channel)
Support for multiple logical drives per drive array
Removable Array Accelerator - battery-backed 4 MB read/write cache with Error Checking and Correcting (ECC)
Read-ahead caching
Online capacity expansion and disk drive upgrades
Fault management features
RAID 5 - Distributed Data Guarding
RAID 5 is also referred to as distributed data guarding because it uses parity data to guard against the loss of data. The parity data is distributed or striped across all the drives in the array. RAID 5 provides very good data protection because if a single drive fails, the parity data and the data on the remaining drives is used to reconstruct the data on the failed drive. With Compaq Smart-2 controller technology, this reconstruction process allows the failed drive to be replaced while the system continues to operate at a slightly reduced performance. RAID 5 also offers good performance because spreading the parity across all the drives allows more simultaneous read operations.
The usable disk space when using RAID 5 depends on the total number of drives in the array. If there are three drives, 67 percent of the disk space is usable for data, with the remainder being used to support fault tolerance. If there are fourteen drives, 93 percent of the disk would be available. The tests that follow used seven drives.
RAID 1 - Drive Mirroring
RAID 1 is also referred to as drive mirroring. This is typically the highest performance fault tolerance method. RAID 1 is the only option for fault tolerance if no more than two drives are selected. Drive mirroring works as its name implies, storing two sets of duplicate data on a pair of disk drives. Therefore, RAID 1 always requires an even number of disk drives. From a cost standpoint, RAID 1 is the most expensive because 50 percent of the drive capacity is used for fault tolerance.
If a drive fails, the mirror drive provides a backup copy of the data and normal system operation is not interrupted. A system with more than two drives may be able to withstand multiple drive failures as long as the failed drives are not mirrored to one another.
RAID 0 - No Fault Tolerance
RAID 0 means that no fault tolerance is provided. The data is still striped across the drives in the array, but it does not include a method to create redundant data. If one of the logical drives fails, data on that drive will be lost. None of the logical drive capacity is used for redundant data, so RAID 0 offers the best processing speed, as well as capacity. RAID 0 is appropriate for applications that deal with non-critical data requiring high-speed access.
Figure 4 shows our performance results with various levels of fault tolerance.
Figure 4: Fault tolerance performance comparison.
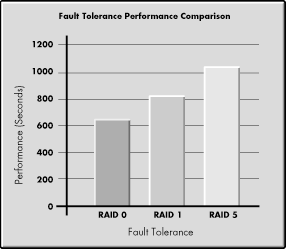
Novell/Compaq test results show a measurable difference in response time rates between RAID 1, RAID 5, and RAID 0. RAID 0 achieved the best performance, outperforming RAID 5 by 10-20% in response. Keep in mind that while RAID 0 utilizes available disk space most efficiently, this level offers no fault tolerance protection. Based solely on response time, the recommendation would be to use RAID 1 over RAID 0 because of the performance gains expected, combined with the hardware fault tolerance protection. RAID 5 would be for data that is not mission-critical, and would offer better usage of disk capacity than RAID 1.
Controller Read/Write Ratio. The Compaq Smart-2 Array Accelerator has a read/write cache ratio that can be customized to fit your GroupWise Server activity using the Compaq Array Controller Configuration Utility. The configuration utility assigns 4 MB of cache memory to read/write operations. The following ratios are possible:
0% Read / 100% Write
25% Read / 75% Write
50% Read / 50% Write
75% Read / 25% Write
100% Read / 0% Write
The results charted in Figure 5 show a performance comparison with the Array Accelerator read/write cache configured with two read/write ratios.
Figure 5: Results for Smart-2P Disk Array Accelerator configured with various read/write ratios.
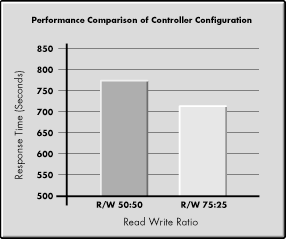
As the chart illustrates, the 75% Read/25% Write ratio yields the best response time for RAID 0 and is the ratio recommended by Novell and Compaq engineers. This improvement in performance can be explained by the additional read-related work the test script performs.
Networking Subsystem
In a test environment that is purely Novell GroupWise, the networking subsystem is less likely to cause performance problems than the subsystem areas previously discussed. In an enterprise network environment, however, the network subsystem becomes a performance factor due to the replication that occurs between servers. The "Networking Subsystem" section under "Performance Tuning" offers guidelines for identifying performance problems that are network-related. Also presented are network management guidelines, as well as strategies for increasing network throughput should this subsystem become the source of performance issues.
This section deals with two performance enhancement strategies: segmenting the LAN and increasing the LAN bandwidth by migrating to 100 Mbps Ethernet cabling.
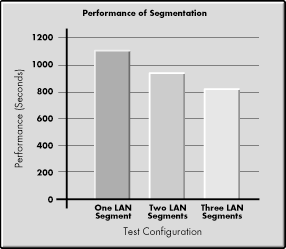
Segmenting the LAN. A key strategy that can increase networking subsystem performance is dividing a single Ethernet segment into multiple network segments. If you determine the networking subsystem is not reaching optimum throughput, there are two network implementations that can improve the overall throughput and general performance gain of a network:
Physical segmentation. To physically segment a network, you must first add more network inferface cards (NICs) to the server and then balance the network load among the multiple NICs. Segmenting a network by adding additional NICs and hubs has the added benefit of creating separate collision domains. Creating additional collision domains minimizes packet collisions by decreasing the number of workstations on the same physical network.
Network switching technology (microsegmenting). Switching hubs, much like routers and bridges, also provide LAN segmentation capabilities. LAN switches provide dedicated, packet-switched connections between their ports. The packet-switched connection provides simultaneous switching of packets between the hub ports, which increases the available bandwidth.
Figure 6 shows the performance comparison chart for three LAN segments.
Figure 6: Performance of segmentation.
Migrating to 100-Mbps Technology. Migrating a network Ethernet implementation from 10Base-T to 100Base-TX or 100VG-AnyLAN provides 100 Mbps of shared bandwidth for the LAN clients. Implementing this type of change can substantially improve network throughput and overall performance. A gradual migration to the faster Ethernet technology does not have to be expensive and time consuming. Partially converting your LAN is a viable alternative to converting all clients on the LAN simultaneously.
The advantages of upgrading a server to a 100-Mbps NIC while accommodating existing LAN clients with a bandwidth of 10 Mbps are as follows:
Cost effectiveness. Upgrading is not as expensive as converting all clients at the same time.
Better throughput. Aggregate network throughput is improved because the transmission speed is faster from the server to the hub.
Ease of upgrade. Replacing 10-Mbps NICs with 100-Mbps NICs is not hard.
No complex cable requirements. You can use your existing 10-Mbps cable.
The disadvantages of upgrading the server NIC to 100 Mbps while leaving clients at 10 Mbps are:
Cost. Replacing existing 10-Mbps NICs with the more expensive 100-Mbps NICs might be cost-prohibitive, depending on the number of NICs being replaced.
Re-routing all existing clients to a switching hub is required. Depending on the number of clients, this can be an inconvenience to an administrator.
Reviewing Migration Results. To compare and evaluate 10-Mbps Ethernet and 100-Mbps Ethernet, parallel test environments were set up in the integration testing labs at Compaq. The results compare a 10-Mbps Ethernet LAN with that of a 100-Mbps Ethernet LAN.
Note: The testing tool NetBench used for network subsystem analysis is not the same as and should not be confused with the test program mentioned previously.
The table below shows the NetBench 4.0 throughput results for a maximum of 10 clients running at 10-Mbps and 100-Mbps Ethernet on a single-segment LAN.
|
Number of Clients |
Ethernet Bandwidth |
Total Throughput (Mbps) |
|
4 |
10 Mbps |
9.3 |
|
10 |
10 Mbps |
9.4 |
|
4 |
100 Mbps |
69.3 |
|
10 |
100 Mbps |
90.1 |
The intraNetWare Performance Monitor indicates the total throughput for the NetFlex-3/P controller installed in the server. Compare the throughput of the 10-Mbps NIC to that of the 100-Mbps NIC. Theoretically, the maximum data transmission rate should increase by a factor of 10 when migrating from the 10-Mbps NIC to the 100-Mbps NIC.
Figure 7 is a graphical representation of one Ethernet segment of 10-Mbps and 100-Mbps clients (IPX protocol).
Figure 7: Results of total throughput.

These results are from a NetBench 4.0 monitoring session where Total Throughput was captured for a ProLiant 1500 server equipped with a NetFlex-3/P Controller (100-Mbps TX Module). The graph illustrates that the Total Throughput increased as the number of clients increased, then leveled off at 8 clients.
In general, if total throughput stays around 50 percent or better on a consistent basis, your LAN is approaching network saturation or may be bottlenecked. In both of our test cases, the LAN saturated at 8 clients. Reaching saturation level with such a low number of clients indicates a need for segmenting the LAN to distribute the workload.
As noted, these testing results indicate wire saturation for a very low number of users because NetBench creates a test environment that simulates network demand placed on a file server; every client reads the same data from a data file. The use of a synthetic network measuring program (NetBench) and the even distribution of work caused the low saturation point. Thus, this testing does not represent a typical LAN environment of several hundreds or thousands of users arbitrarily broadcasting over the entire LAN via router(s), bridge(s), and gateways. In a real-world environment, network clients should not reach wire saturation for so few users, as indicated in Figure 6. The data show the wire bandwidth difference between 10 Mbps and 100 Mbps, as well as the effect of increasing the user load.
Performance Tuning
Bus System Tuning
Compaq introduced dual peer PCI buses with the ProLiant 5000 for added performance and reliability. For performance, both buses are independent, allowing a full 267 MBps of I/O. For added reliability, the ProLiant 5000 offers support for redundant 10/100 TX PCI UTP NICs, as well as redundant disk controllers. With redundant controllers installed, the system can remain operational even if a disk or network controller fails or if there is a PCI bus failure. Installing redundant controllers on separate PCI buses insures maximum possible reliability.
In order to avoid I/O contention, the following configuration of the ProLiant 5000 server is recommended.
|
One network controller and one array controller |
||
|
Device |
Bus |
Slot |
|
10/100 TX PCI UTP |
Secondary |
2 |
|
SMART-2/P Array |
Primary |
5 |
|
One network controller and two array controllers |
||
|
Device |
Bus |
Slot |
|
10/100 TX PCI UTP |
Secondary |
2 |
|
SMART-2/P Array |
Primary |
5 |
|
SMART-2/P Array |
Secondary |
3 |
|
Two network controllers and one array controller |
||
|
Device |
Bus |
Slot |
|
10/100 TX PCI UTP |
Secondary |
2 |
|
SMART-2/P Array |
Primary |
5 |
|
10/100 TX PCI UTP |
Primary |
6 |
|
Two network controllers and two array controllers |
||
|
Device |
Bus |
Slot |
|
10/100 TX PCI UTP |
Secondary |
2 |
|
SMART-2/P Array |
Primary |
5 |
|
10.100 TX PCI UTP |
Primary |
6 |
|
SMART-2/P Array |
Secondary |
3 |
Note: Slots 5, 6, 7, and 8 are on the primary bus; slots 2, 3, and 4 are on the secondary bus.
Hard Disk Controller Tuning
Some of these features offer performance and fault tolerance advantages, which were discussed in an earlier section detailing hardware versus software striping, and the number of drives supported in an array. Now the performance impact of the Smart-2 Controller Array Accelerator will be examined.
The Smart-2 Controller Array Accelerator serves as a read-ahead and write cache that dramatically improves the performance of read and write commands. The Array Accelerator performance gains are best seen in database and fault-tolerant configurations. The Smart-2 Controller writes data to 4 MB of cache memory on the Array Accelerator rather than directly to the drives, allowing the system to access this cache more than 100 times faster than accessing the disk. The data in the Array Accelerator is written later to the drive array by the Smart-2 Controller when the controller is otherwise idle.
The Array Accelerator also anticipates requests as another method of increasing performance. A multi-threaded algorithm is used to predict the read operation most likely for the array. That prediction is used to pre-read data into the Array Accelerator so that data may be there before you access it. If the Smart-2 Controller receives a request for cached data, it can be burst into system memory at PCI or EISA bus speeds.
NetWare Operating System Tuning
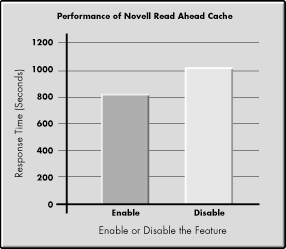
SET Read-Ahead Cache. A GroupWise Server tunable parameter that impacts the system performance is the Read Ahead Cache which is the amount of memory allocated to the GroupWise Server specified in bytes.
Novell and Compaq engineers recommend using the default read-ahead cache due to the 15-20% performance gain shown in Figure 8.
Figure 8: Performance of Novell Read Ahead Cache.
SET Packet Receive Buffers. Another GroupWise Server tunable parameter that impacts system performance is Packet Receive Buffers. The more packet receive buffers a system has, the better the server's performance; however, these buffers use system memory needed by processes, so you must balance buffer allocation against available memory.
The server automatically adjusts the allocation of buffers between minimum and maximum. The server will allocate more buffers to handle the load. Over time, it will reach an optimum setting that provides the best performance; however, some performance degradation will occur during the system ramp-up. Novell and Compaq engineers preset the packet receive buffers to an optimum setting and yielded a 10-15% performance gain. Therefore, our recommendation is to use the MONITOR to determine what the server's dynamic allocation of Packet Receive Buffers, and change that parameter to what the server dynamically configured.
Performance Conclusions
This section presents conclusions and recommendations for performance management, based on the performance tests and data analysis carried out by Novell and Compaq engineers.
System Processor
Research clearly shows that the CPU was found to be the most important server subsystem affecting overall system performance of the GroupWise Server. The conclusion is that the faster the processor, the better the performance gains for the system. Therefore, Novell and Compaq engineers recommend the fastest processor that can be purchased within the budgetary limitations of your project. Furthermore, the performance of the Pentium Pro processor clearly shows that its superior features help contribute to the improvement in performance over the Pentium processor rated at the same clock speed.
Memory
In addition to intraNetWare's memory requirements, you should add the following amount of memory to the total system memory.
|
Concurrent Users |
Machine Recommended |
Actual ServerMemory UsedDuring Peak Time |
|
100 active users and actual post office; 100 - 250 users |
Pentium 90 MHz |
42 MB |
|
250 active users and actual post office; 250 - 500 users |
Pentium 133 MHz |
104 MB |
|
500 active users and actual post office; 500 - 1000 users |
Pentium Pro 200 MHz |
116 MB |
|
1000 active users and actual post office; 1000 - 2500 Users |
Pentium Pro 200 MHz |
137 MB |
Disk Subsystem
Novell and Compaq engineers recommend disk striping to benefit from the gain in I/O performance. The recommendation is to use numerous smaller drives in an array rather than a few larger drives to achieve the best overall system performance providing comparable storage capacities.
Hardware striping is recommended due to performance gains, as well as more system resource efficiencies than when using software striping. Hardware striping is achieved by Compaq's Smart-2 Array Controller, which also has built-in data protection features, adding another benefit over software striping.
Fault Tolerance is strongly recommended by Novell and Compaq engineers. RAID 1 is the preferred level of fault tolerance for systems that have mission-critical data, while RAID 5 is recommended for systems storing non-critical data. RAID 1 is the preference due to a combination of high level performance and protection of the data. RAID 1 uses disk mirroring, providing good data protection at the cost of low utilization of actual disk capacity. Disk mirroring uses 50% of available disk space for fault tolerance support. RAID 5 uses distributed data guarding, striping data and parity data across all drives in the array. The more drives in the array, the lower portion of each drive reserved for fault tolerance support.
Set the Smart Array Controller read/write ratio to an appropriate level. In our test case, the optimal ratio is 75:25, due to the read-intensive environment. However, because this parameter is very application-specific, users should do their homework before changing it.
Using the largest volume block size is recommended.
Conclusion
These preliminary tests show that a Compaq ProLiant 800 can successfully sustain 500 users and a ProLiant 5000 can sustain 1000 users. These tests demonstrate that Compaq hardware is a viable solution for GroupWise needs. The combination of intraNetWare, GroupWise, and Compaq servers delivers a level of performance, scalability, and reliability that will help customers realize a high return on investment.
More detailed information was obtained after further testing at Novell's SuperLab facility, where the full Compaq server product line was tested in multiple configurations under client loads in excess of 1000 users. The results of these tests will be presented in a future AppNote.
* Originally published in Novell AppNotes
Disclaimer
The origin of this information may be internal or external to Novell. While Novell makes all reasonable efforts to verify this information, Novell does not make explicit or implied claims to its validity.