A Study of Novell Directory Services Performance and Benefits
Articles and Tips: article
Senior Research Engineer
Novell Systems Research
01 Jul 1996
In early 1996, Novell Research conducted a study of customers' implementations of Novell Directory Services (NDS). The purpose of this study was to gather information that could be of benefit to network designers, installers, and administrators in building an efficient and powerful Directory with NetWare 4. This AppNote presents the results of this study, along with recommendations on what works well and what to avoid in a production network.
RELATED APPNOTES Apr 96 "Ten Proven Techniques for Improving NDS Performance and Reliability" Apr 96 "Universal Guidelines for NDS Tree Design" Mar 96 "Understanding SCANTREE.EXE's Statistics" Jan 96 "Using SCANTREE.EXE to Gather NDS Tree Statistics"
Introduction
Novell Directory Services (NDS) provides an important value proposition for Novell's customers. That proposition is that you can move away from the server-centric administrative model you've been using prior to NDS and implement a network-centric administrative model. Your ability to provide users with a single login to your multi-server environment is just the beginning. Amoung other things, the NDS value proposition says that, over time, you'll be able to pull back all the intelligence you've placed out at the client, such as custom login scripts with their intricate application logic, and embed it into the centrally-administered Directory. That is a powerful value proposition for anyone who has designed or managed a network.
However, this transition from server-centric to network-centric administrative model is not an easy one. Moving to the network-centric model requires a substantial change in the way you think about your network and how you roll out services to your users.
To find out how this transition was progressing among Novell's customer base, we placed an invitation in the Novell Application Notes for our readers to participate in a study of NDS implemen-tations. We asked participants to run an NDS tree walker utility on their Directories and return its output for analysis. We also asked them to answer some survey questions concerning what they felt were the performance characteristics and benefits of using NDS in their organizations.
In response to this invitation, we received tree characteristics and survey data from a total of 115 organizations comprising over 306,000 users and 2,700 NetWare 4 servers. Our sincere gratitude goes out to those who chose to participate.
The Study
This study is a first-cut analysis of real-world implementations of NDS. Although the study was not comprehensive, the results suggest some important trends that will greatly benefit those who are managing present and future implementations of NDS.
Here are some of the highlights from the study results:
Organizations that are making a significant investment in NDS, using its full feature set and tailoring their Directories to the specific needs of their organization, are extremely happy with the return on their investment. In the words of one respondent from an American aerospace firm, "NDS has greatly simplified almost all aspects of our network management."
Sophisticated use of NDS in the majority of surveyed organizations is not happening overnight. Much of the delay is due to the fact that 60% of the survey's respondents are still managing mixed NetWare 3.x/4.x server environments. The time and resources lost due to the administration of these mixed environments is a significant deterrent that is keeping these organizations from fully benefiting from NDS. "We're at the early stages of 'real' use," and "Far more of our time is spent administering the 3.x environment" were common refrains.
NetWare administrators have much more control over the performance and benefits of NDS in their organization than early documentation led them to believe. It is now clear that network administrators can reap significant improvements in performance and benefits by following the more recently-documented NDS design guidelines and management techniques.
The study's findings, as well as the written comments of the respondents, are being used by Novell's Engineering and Marketing organizations that have responsibility for NDS. As a result of this study, several important changes in the NDS product have already been made and will continue to be made in future releases.
Novell Research is also publishing a series of AppNotes to improve your NDS design and optimization skills and to help you overcome several problem areas identified by the study. Two AppNotes in this series have already been published, covering initial tree design as well as performance and reliability optimizations:
"Universal Guidelines for NDS Tree Design" (Apr 96)
"Ten Proven Techniques for Improving NDS Performance and Reliability" (Apr 96)
Survey Results
Each of the responding organizations returned a completed survey. The survey included 60 questions concerning their organization and implementation of NDS, covering:
Organization type and size
Tree completion status
Network configuration
NetWare server configuration
NDS performance
NDS benefits
NDS enhancements
Almost all of the respondents included additional comments on many of the questions. These insights were extremely valuable to us because each comment helped us understand the context of the survey answers.
Who Responded?
Results from the study represent 115 organizations. Together, these organizations included 306,823 users and 2,756 NetWare 4 servers. The combined growth projection of the 115 organizations spans more than 10,000 NetWare 4 servers over an extended period of time.
The smallest organizations in the study had a single NetWare 4 server with 20 and 30 users. Several of the largest organizations had over 40,000 users and more than 500 NetWare 4 servers.
Almost two-thirds (63%) of the study responses came from the Americas, including a few from South America, several from Canada, but the majority coming from the United States. Slightly less than one-third (31%) of the responses came from the Europe-Middle East-Africa region, with several from South Africa, one from Israel, and the majority from the United Kingdom. A small portion (6%) came from the Asia-Pacific region, with the majority coming from Australia.
Types of Organizations
Figure 1: What kinds of organizations responded?
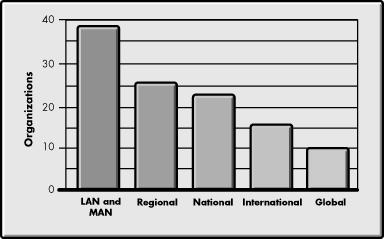
The largest segment (35%) of the organizations classified themselves as local. However, this classification can be misleading because it includes not only small offices and networks occupying a single building, but also campus and metropolitan area networks (MANs). Therefore, some of the largest organizations, including universities and city governments, were included in the "local" category. The other organizations classified themselves as regional (23%), national (20%), international (14%), or global (8%).
Size of User Communities
Figure 2: How large are their user communities?
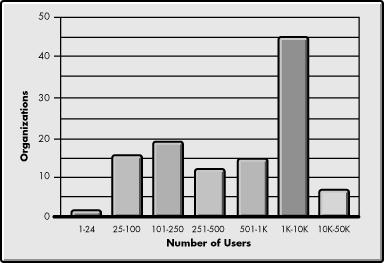
Based on number of users, the majority of the surveyed organi-zations were large: two-thirds of the organization had more than 250 users and nearly half (45%) had more than 1000 users. Only one surveyed organization had fewer than 25 users.
This strong bias toward larger organizations is partly due to the size of organizations that subscribe to the Novell Application Notes, where the study invitation was published. The majority of AppNote subscribers work for organizations that have more than 24 network seats.
Tree Configurations
Figure 3: How many organizations have multiple trees?
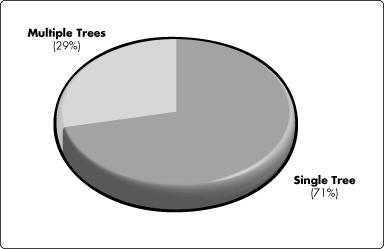
29% of the organizations had multiple trees. Of those, over three-quarters said their multiple trees would be merged into a single production tree at some future time. The rest of the multiple-tree respondents mentioned several viable uses for their extra trees, including:
Testing of NDS applications and scenarios
Training of new administrators
In-house development of NDS-aware applications
Figure 4: What is the status of their trees?
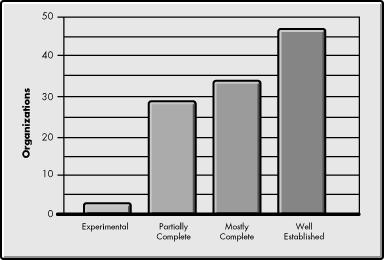
Only three of the respondents described their trees as being in an experimental stage. The remaining trees were all in production and in one of three stages of completion: 25% partially complete, 30% mostly complete, and 42% well-established. However, well-established doesn't necessarily mean "done" because most of these trees were in organizations still migrating NetWare 3 servers to NetWare 4. For most of these organizations, "well-established" meant they had completed the NDS learning curve, had a proven naming convention and other standards in place, and had completed the design phase of the NDS implementation process.
If you combine the "mostly complete" and "well established" categories, 72% of the surveyed organizations felt their trees were mostly complete. This suggests that the majority of the survey data is coming from a relatively experienced group of administrators.
WAN Infrastructure
Figure 5: How many site's trees traverse WAN links?
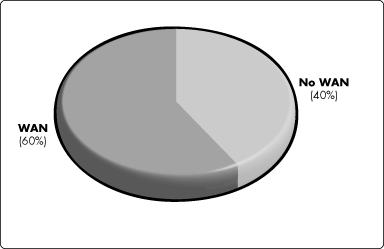
60% of the organizations' trees traverse WAN links, whereas 40% had no WAN links.
Figure 6: What WAN technologies are they using?
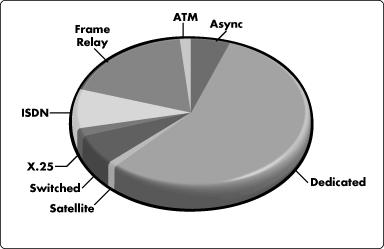
The WAN technologies in use ranged from dedicated leased lines (55%), to frame relay (20%), to a variety of switched services (25%).
Figure 7: How does organization size correlate to the possesion of WAN technology?
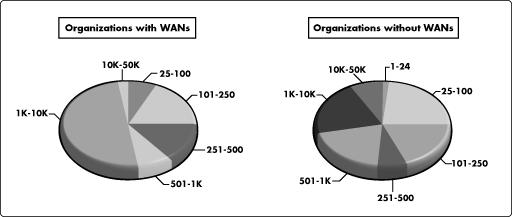
The majority of organizations whose trees traversed WAN links were large, with over 50% having more than 1000 users. The other half of the organizations were evenly spread among the other sizes. Organizations whose trees did not traverse WAN links saw the greatest distribution of user communities. This is due to the large number respondents whose networks encompass campus or metropolitan area networks without any WAN links. Some of the largest trees were from universities and local city governments.
Server Hardware
Figure 8: What kinds of server hardware are they using?
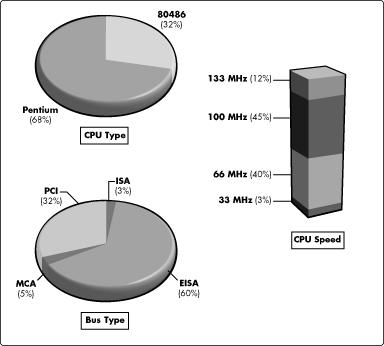
The majority of respondents were using Pentium-based servers. The rest were using 486-based systems. Although no one reported the use of 386-based servers, there were a few low-end 486 systems running at 33MHz. The rest were running at 66MHz or above. The majority of these systems were using the EISA expansion bus.
NDS Performance
We asked several questions concerning the performance of NDS. Some of the questions were related to end-user perceptions concerning the time it takes to log into the network. Other questions were related to the administrator's perception of performance during day-to-day object changes, as well as during less frequent structural changes.
18% said they were receiving complaints from users concerning login performance. A portion of these said the complaints were occasional. But for most of those having problems, poor login performance was a significant irritant. One respondent described a South American manufacturing company's problems with the simultaneous login of several hundred users following frequent power outages.
Three-quarters of the respondents said administrative operations could be faster. These operations ranged from day-to-day types of operations such as password changes to major partition operations that take place when the structure of the tree is changed.
Apart from their satisfaction with specific areas of performance, we asked about their general level of satisfaction with the performance of NDS, to give us a better context within which to understand any problems.
Figure 9: How many are satisfied with their tree's performance?
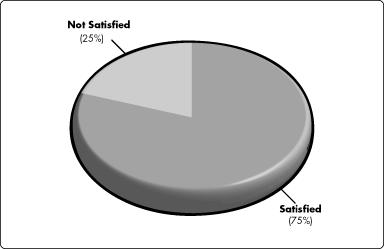
In answer to this question, 75% of the respondents said they were satisfied with their tree's performance.
Benefits of NDS
We asked several questions about what the respondents felt were the benefits of using NDS in their organizations. We were interested to see if a correlation existed between the use (or non-use) of some of NDS's features and the organization's perceived value of NDS's services.
Time and Money Saved. First, we asked whether NDS was saving them time and money. About one-third (30%) answered "No" to this question, ALThough many of these added the qualifier "not yet." Upon closer examination, we found that this group was facing several hurdles that limited the savings of time and money for their organizations. These hurdles fell into four categories:
Continued administration of a NetWare 3.x installed base. This was the most common explanation, with 60% of the "no" voters mentioning this as their greatest obstacle.
The learning curve involved in designing and administering an NDS tree.
Single-server configurations in which many of the time and money saving benefits of NDS do not come into play.
The use of NDS to simply recreate a "pseudo-bindery" environment, thus not taking advantage of NDS's features and benefits.
On the positive side, 70% answered "Yes." Many of these positive respondents described the ways that NDS was making life easier. Their comments generally fell into three categories:
Centralized, single point of administration
A single user ID and password for each user
The benefits of network-centric administration
Many comments mentioned using NetWare 4 to overcome the difficulties of managing multi-server environments in NetWare 3. For example, one respondent said "Yes, we have now eliminated all of the 3.x servers from the network. Entering users is done once and cross tree authentication lets us provide resources as required. [NDS] has greatly simplified the user ID creation process especially."
Another respondent said "Yes, maintaining OU login scripts is easier than using group memberships [in NetWare 3]. We're frequently adding new OUs (offices), and it's very simple to set up the new LANs centrally using NWADMIN."
One respondent, from a state government, said "Yes, we now spread services out amoung other servers which we wouldn't have done when running NetWare 3 due to the administrative burden."
Is NDS Earning Its Keep?
As the final question, we asked how much respondents felt NDS was "earning its keep" in their organization. Similar to the question about their general satisfaction with NDS performance, this question helped us gauge their overall satisfaction with NDS--was NDS really doing for organizations what Novell promised it would?
The question included five possible responses and room for comments:
How much is NDS "earning its keep" in your organization? (choose one):More trouble than it's worth (Y/N): We're breaking even (Y/N): Somewhat (Y/N): Very much (Y/N): Does everything but cook breakfast (Y/N): Please explain:
The answers to this question (Figure 10) were an honest appraisal of the value NDS was providing these organizations at the time of the survey.
Figure 10: Is NDS "earning it's keep"?
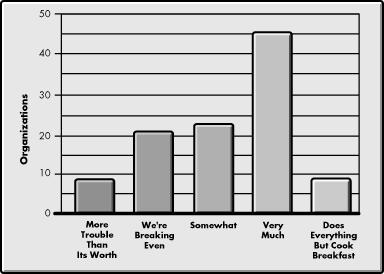
While we don't have room in this AppNote to detail all of the respondents' answers and comments, it is instructive to look at both ends of the chart-- those with emphatic positive and negative votes.
"More Trouble Than It's Worth". Nine of the respondents chose "more trouble than it's worth." We'll detail each of these nine responses here, because we discovered, either through their survey responses or SCANTREE data, that each one of these organizations had significant NDS design or configuration problems.
Four of the nine respondents said NDS was more trouble than it's worth because of performance problems. Actually, these problems stemmed from not following Novell's recommendations for optimal NDS implementation, not from any inherent flaw within NDS itself:
One of these four respondents had 1400 replicas on 13 servers. This over-partitioning creates such tremendous synchronization overhead that day-to-day operations wouldbe nearly impossible.
Another of the respondents had servers with only half as much memory as is recommended by the Novell Research Server Memory Worksheet (see "Calculating Memory Requirements for NetWare 3 and 4" on p. 123 of the January 1995 issue of AppNotes, and "Tuning the Server Memory Calculation Worksheet" in the November 1995 issue, p. 91).
Another demonstrated an over-reliance on Groups rather than using NDS containers to perform the same function more efficiently.
The fourth respondent described implementing a very large national Directory without running a pilot test of their initial design. Not surprisingly, theirs required a redesign.
Three of the nine chose "more trouble than it's worth" because they knew they weren't yet using NDS's full capabilities.
The remaining two were simply "homesick" for NetWare 3's bindery because they didn't have multi-server LANs and wanted to retain their server-centric view of their systems.
A significant point to make here is that the solutions to all of these problems lie completely in the hands of the customers. By following Novell's published design and optimization guidelines, all of these performance problems can be eliminated.
"Does Everything But Cook Breakfast". Nine of the respondents chose "does everything but cook breakfast." Their comments included:
"Good analogy" "What could be easier?" "Multiple server administration is effortless" "Saves time, and time is money" "As painless as it gets" "Easier to control licensing" "Definitely a keeper" "It does everything NW3 did plus..." "The principle limitation is one's own imagination..." "Yes! As we have now eliminated all of the 3.x servers from the admin network, entering users is done once and cross tree authentication lets us provide resources as required. It has greatly simplified the user ID creation process especially." "My staff of 7 administers 75...servers in a mixed 4.x and 3.x environment. Far more of our time is spent administering the 3.x environment." "Facing serious budget cuts, NDS has helped us maintain service levels with less staff."
Based on these comments and the rest of the survey data, it became clear to us that organizations were reaping significant benefits once they invested the necessary time and resources to "do NDS right."
SCANTREE Results
|
Where to Get SCANTREE You can locate SCANTREE.EXE and the original study materials: |
via ftp at ftp.novell.com/pub/updates/nwos/nw410/scands.exe
via CompuServe's NovUser forum
For more information on SCANTREE and the full description of its statistics and options,see "Using SCANTREE.EXE to Gather NDS Tree Statistics" (Jan 96) and "UnderstandingSCANTREE.EXE's Statistics" (Mar 96).
In addition to answering the survey questions, each respondent used the Novell-provided SCANTREE.EXE utility to traverse their NDS tree and record all object classes found therein, the instances of objects within each class, and a series of summary statistics. We collected and studied this data for two reasons:
The SCANTREE data became part of the real-world design criteria for in-house NDS performance and reliability tests.
The SCANTREE data helped us develop several techniques for estimating the amount of server memory required to satisfy the needs of different NDS configurations.
Again, we don't have room to detail all of the SCANTREE statistics in this AppNote. The following sections summarize some of the more interesting statistics.
Number of Objects
SCANTREE recorded the total number of objects and the number of user objects in each respondent's tree.
Figure 11: Users (as a percentage of the tree's total object count).
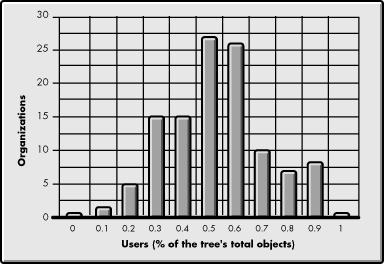
As a percentage of total objects, User objects (on average) make up 35% of an organization's tree when NDS's full feature set is used. This average is a useful factor in estimating the total number of objects in a new tree, based solely on the number of users you are building the tree for.
However, there are exceptions when using this average. Several organization types, such as universities, have a unique user-to-resource ratio. As a result, 90% or more of these organizations' trees are made up of user objects. For example, one university's SCANTREE results included 26,905 user objects out of a total of 27,448.
There are also notable exceptions at the other end of the scale. At 18%, one organization had 614 user objects out of a total of 3360 objects. This organization liked the functionality of directory map objects and ended up configuring 2161 directory maps. They had tailored NDS to suit their purposes.
At a more typical 37%, one organization had 204 user objects out of a total of 750. In addition to user objects, they had configured 230 directory maps, 76 groups, 44 organizational roles, and 38 profiles among others. This percentage represents a commercial organization's full-featured use of NDS.
Object Attributes
The average number of attributes (Figure 12) and average attribute size (Figure 13) statistics, were helpful in our design of real-world performance tests.
Figure 12: Average number of attributes per object (by organization).
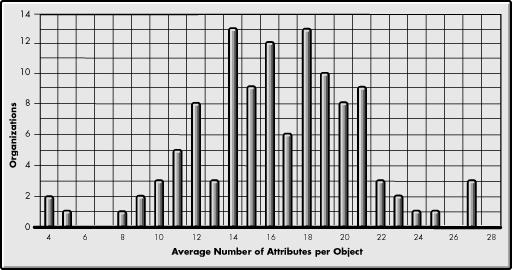
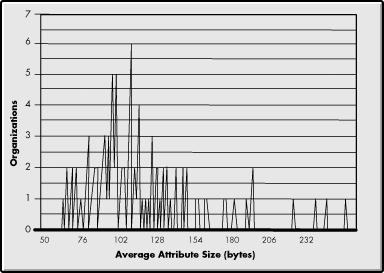
Figure 13: Average attribute size (by organization).
Group Memberships
The number of group memberships per user (Figure 14) was one of the most interesting statistics.
Figure 14: Average group memberships per user.
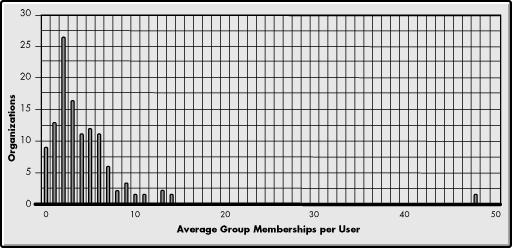
Whereas the large majority of organizations had fewer than 10 group memberships per user, one 614-user organization had 48 memberships per user, for a total of 29,527 group memberships.
This may seem like a large number, but if you multiply the 614 users by the 297 groups to which each user could potentially be a member, you come up with a potential group membership of over 180,000. So this organization was nowhere near their potential for group memberships.
Contrary to what some have been led to believe concerning large groups, this organization was happy with NDS's performance. How? They built their network infrastructure to handle the additional horsepower required by very large groups. Their system consisted of 100MHz Pentium servers with 25MB of addition RAM connected by a 100Mbps LAN. This emphasizes the fact that you can exceed the recommended design limits of NDS if you compensate for it in additional system horsepower.
Replication
Multiple replicas are the foundation of NDS's reliability. So we were curious to see if the respondents were following Novell's recommendation to have at least three replicas of each partition. Based on the SCANTREE results in Figure 15, the majority of organizations are running with the recommended margin of safety.
Figure 15: Average number of replicas per partition.
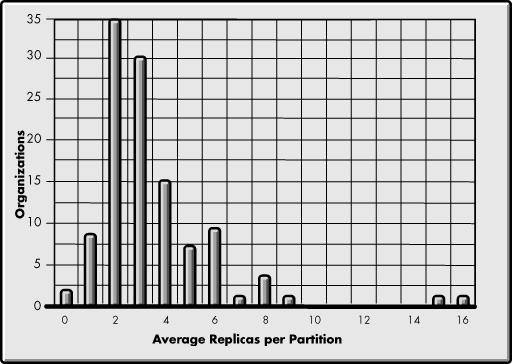
Several organizations with single-server implementations didn't have any replicas. Their fault-tolerance plan includes frequent backups of the NDS tree.
Several organizations at the other end of the chart had 15 and 16 replicas per partition. This is not necessarily bad, depending on how many servers the replicas are spread out among. For example, the organization with 16 replicas per partition is okay. They had 16 servers with one master replica and 15 read/write replicas. However, the tree with 13 servers, 143 partitions, and over 1400 replicas is definitely over-partitioned and resulted in poor performance.
Recommendations
As a result of the data and comments gleaned from the study, and in conjunction with our own in-house benchmarking, we've isolated several characteristics that are directly related to end-user and administrative performance problems with NDS.
Trees with one or more of the following characteristics need to be optimized:
Less-efficient placement of WAN infrastructure in the tree.
Less-efficient arrangement of physical network resources.
Lack of sufficient server horsepower.
Lack of sufficient NWADMIN client horsepower.
Performance of major partition operations without knowing the status of the partition's servers.
Group objects that contain very large memberships.
Group objects whose memberships span partition boundaries.
Group objects that contain general membership placed at the top of the tree.
This is good news because administrators can overcome every one of these factors by following Novell's documented performance optimization guidelines. Ranging from simple alterations to more extensive redesigns, the guidelines to follow are:
Partition the tree along WAN or geographic boundaries.
Place your network's physical resource objects close to the user objects that use them.
Provide NDS with sufficient server horsepower including CPU, cache, and I/O channel.
Provide your NWADMIN client with sufficient horsepower.
Check the status of a partition's servers before performing major partition operations.
Monitor major partition operations to completion.
Use containers as logical groups.
For more information on these performance optimization guidelines, see "Ten Proven Techniques for Improving NDS Performance and Reliability" and "Universal Guidelines for NDS Tree Design," both in the April 1996 issue of Novell Application Notes.
Based on our SCANTREE results, nearly 50% of the respondents' trees are merely "pseudo-binderies"--trees that mimic the server-centricity of the NetWare 3.x bindery. When migrating to NetWare 4, administrators must decide whether they're going to build a true Directory or simply shoehorn their existing NetWare 3 bindery configuration into NDS. Our study clearly shows that administrators who pass up the opportunity to take full advantage of NDS are short-changing themselves and their organizations. It is definitely worth the time and effort to learn how to "do NDS right."
The study shows that NDS has the necessary power and flexibility to ease the administrative burden of networks of all sizes. Even administrators of single-server networks are in the driver's seat when it comes to the performance and benefits their organizations derive from their network investment. (See "If You Are Designing a Small Tree [or a single-server LAN]" in the "Universal Guidelines for the Design of NDS Trees" AppNote, p. 22.)
Finally, thanks to this study Novell better understands why the shift from server-centric to network-centric administration is taking more time than we had originally estimated. True, the time and resources necessary to implement a radically new administrative paradigm are significant. However, once these hurdles are overcome, many customers are moving forward successfully, drawing upon the full functionality of NDS to tailor their implementations to the specific needs of their organizations--and they are enjoying a significant return on their investment as well.
* Originally published in Novell AppNotes
Disclaimer
The origin of this information may be internal or external to Novell. While Novell makes all reasonable efforts to verify this information, Novell does not make explicit or implied claims to its validity.