Large NetWare Networks: Results of Compaq's 1000-User Server Benchmark Tests
Articles and Tips: article
North America Systems Engineer
Compaq Computer Corporation
XUE (STEVEN) HU
North America Systems Engineer
Compaq Computer Corporation
01 Mar 1996
As networks grow to support more and more clients, there is a need for reference information regarding server consolidation, capacity planning, and performance expectations. This Application Note presents the results of benchmark tests performed with Compaq Computer Corporation's ProLiant 4500 "superservers" on a large NetWare 4.1 network at Novell's SuperLab facility. These tests provide baseline data for comparing large network performance and should help customers better anticipate the upper limits of NetWare server capacity.
- Seeking Answers to Capacity Planning Questions
- Compaq's SuperLab Server Performance Tests
- NIC Test Results
- Disk Mix Test Results
- Conclusions
Seeking Answers to Capacity Planning Questions
Throughout the computer networking industry, there is a growing interest in understanding the capabilities of NetWare 4.1 servers in large networking environments. Consolidation of dispersed Local Area Networks (LANs) into global Wide Area Networks (WANs) is now almost a universal corporate mandate. An increasing trend is seen toward collapsing dispersed networks (consisting of small severs attached to 10 Mbps LAN segments) into concentrated 100 Mbps network trunks feeding into super servers. Such network consolidation requires high-performance servers with the capacity to reliably handle 1,000 or more active connections.
Today's very large client-server environments are pushing the network infrastructure to its capacity limits. Yet many network planners are apprehensive about server consolidation because of the numerous unknowns that exist in the area of capacity planning. Typical questions for capacity planning include:
How many users can be supported by a single server in a given computing environment?
How much memory is needed?
What are the I/O needs?
How will the server platform scale?
How will the network operating system (NOS) scale?
Is NetWare SMP (Symmetric Multiprocessing) needed? If so, how many processors are required in the server?
Other capacity planning unknowns center around platform stability, reliability, and fault tolerance. Finding answers to these questions is no easy task. Because of the hefty equipment requirements, few baseline performance studies have been done on large networks. The dearth of substantiated information is aggravated by sensationalized or misinformed reports being circulated by industry trade journals and competing vendors regarding NOS stability, excessive server CPU utilization rates, and other problems network administrators have experienced in the process of consolidating servers.
To help fill the knowledge void in the areas of capacity planning and server consolidation, Compaq Computer Corporation and Novell, Inc. recently conducted a series of benchmark tests at Novell's SuperLab facility in Provo, Utah. These tests provide data that can be used as a baseline for comparing large network performance. This Application Note describes these tests and interprets the key results and observations. These results offer network planners a baseline point of reference for designing large NetWare 4.1 networks, and should help customers better anticipate the upper limits of network capacity.
Compaq's SuperLab Server Performance Tests
In September 1995, Compaq's engineering support organization engaged Novell's SuperLab to stress-test a ProLiant 4500 "super- server" running NetWare 4.1. The server was outfitted with hardware typical for a large network server. The server and its attached Ethernet network were then monitored with Compaq Insight Manager (CIM) and Novell's LANalyzer for Windows. This test environment is illustrated in Figure 1.
Figure 1: The testbed configuration in Novell's SuperLab.
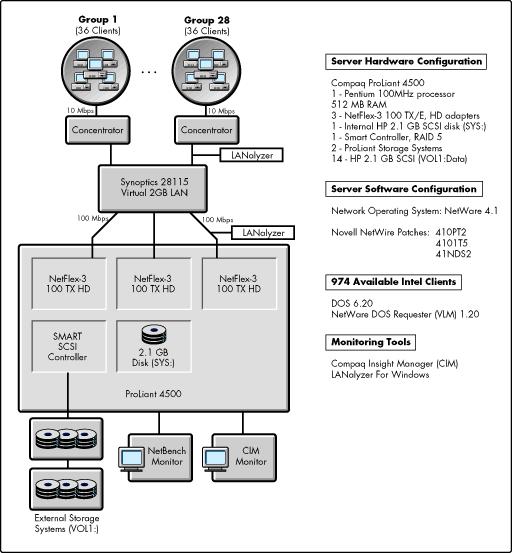
Server Configuration
We configured the ProLiant 4500 server by following the performance tuning guidelines communicated in Compaq's "NetWare 4.1 Performance Management" TechNote. The memory was sized according to the NetWare 3 and 4 Server Memory Worksheet in the January 1995 Novell Application Notes. Due to time limitations for access to the SuperLab, we held the server's hardware configuration parameters constant.
We installed the native version of the NetWare 4.1 network operating system, consulting Novell's Level 3 support engineers to ensure the NOS was optimally configured. Novell engineers advised using the released patches listed in Figure 1. These patches are available through Novell's NetWire service on CompuServe, on the Network Support Encyclopedia CD-ROM, and on Novell's World Wide Web server (http://netwire.novell.com).
|
Note: To be eligible for NetWare 4.x technical support fromNovell Engineering, Novell requires that you have thelatest patches applied. Refer to the README files includedwith the patches for details regarding the NOS enhance-ments and fixes they contain. |
|
RAID 5 was chosen becauseit offers most Compaq customers the best combination of data protection, price and performance. See the Compaq White Paper entitled"Compaq SMART SCSI Array Controller" for RAID alternatives and performance information. This paper can be found on Compaq's WorldWide Web server at http://www.compaq.com, Product Information, Technical Publications, White Papers. |
The 2.1 GB SCSI drive connected to the ProLiant's internal FAST-SCSI-2 controller was configured as volume SYS and was used to launch NetWare. Two ProLiant Storage Systems containing fourteen 2.1 GB drives were configured into one SMART RAID 5 drive. This logical drive contained a NetWare VOL1 data directory, subdivided to allow each of the test bed's 1,000 clients to have access to individual 20 MB directories used for reading and writing unique data. VOL1 also contained a public NetBench directory for benchmark commands and reporting.
Network Topology
Novell's SuperLab support engineers assisted with the test bed's topology design and implementation. Their expertise ensured that file transfer traffic would be balanced across all network segments. In the resulting design, approximately 36 clients were attached to each of the network's 28 LAN segments. Three Synoptics 28115 Ethernet switches were configured into a 2 GB virtual LAN, with concentrated 10 Mbps LAN segments attached and evenly distributed to three 100 TX, half-duplex Ethernet channels. The Synoptics virtual LAN's output channels were connected to three half-duplex NetFlex-3 100 TX/E network adapters residing in the ProLiant 4500 server. (100 Mbps full-duplex connections were not tested because the current version of the NetFlex-3 adapter only supports 100 TX in half-duplex mode.)
Monitoring Tools
Two notebook computers running Novell's LANalyzer for Windows sampled the network's 10 Mbps LAN segments and the 100 Mbps backbone channels. A dedicated workstation equipped with Compaq Insight Manager (CIM) software monitored the ProLiant 4500's CPU and EISA bus utilization levels. An additional dedicated workstation managed and monitored the NetBench benchmarking control program.
|
AboutNetBench 3.0 We selected Ziff-Davis' NetBench 3.0, an industry standard benchmarktest suite, as a network traffic generator. This is a synthetic benchmark that can only emulate "real-world" network activity, not replicate it. Since each customer's network environment is unique, the results of this benchmark may not reflect the particulars of any given production network. In the SuperLab, we used two tests from the NetBench 3.0 suite:the NIC test and the Disk Mix test. The NIC Test is considered to be a network infrastructuretest. This test measures network interface card throughput for both server and client platforms. When executing this test, a large file is initially read into the server's cache memory and each client running the test accesses this same cached file. For the remainder of the test, the server does not need to access the disk subsystem. Our tests used NetBench 3.0's default file size of 1024 KB and default packet request size of 1024 bytes. The Disk Mix test is designed to stress a file server's operatingsystem and its I/O subsystem. The test mirrors the way leading PC applications perform network file operations on a file server. Each clientPC executing the test reads/writes to and from a private directory on the server. Thissynthetic benchmark emulates the I/O operations for the following common desktop applications: |
Lotus1-2-3 for DOS
dBASE IV, Paradox for Windows
WordPerfectfor Windows
Harvard Graphics
cc:Mail
MicrosoftMail for DOS
Microsoft C Compiler
Successful completion for both the NIC and Disk Mix tests requires all client workstations to remain connected to the server for the duration of the test run. If a single client times outs and loses its server connection, either test aborts execution.
Both of these NetBench 3.0 tests generate extremely high rates ofconstant network traffic, whereas typical real-world client traffic is "bursty" bynature. Conservative estimates are that each NetBench 3.0 client may be generating thenetwork traffic equivalent to between five and ten real-world clients. In this document,we take the lower end of this estimation and assume that each client in the SuperLabtest bed could represent five actual clients.
NetBench 3.0 Test Variables
Three NetBench 3.0 test parameters affect the amount of traffic generatedon the network:
Work Space defines how much disk space each client has to setup an dstore its unique test data files.The data files are stored in private directories on the server. Each client's generated network I/O traffic is approximately the size of its Work Space.In the SuperLab tests we held this parameter constant at 20 MB.
GroupSize (per LAN segment) is a variable defining the total number of clients active on each LAN segment. The SuperLab test bed network contained 28 LAN segments. In the SuperLab, LAN segmentsize can vary from 1 to 36 active clients per test run.
ThinkTime tells each NetBench client how long to wait before performing its next chunkof work. In our SuperLab tests, we varied this parameter from 2 to 120 seconds.
These parameters were the only NetBench parameters we varied during the SuperLab tests.
NIC Test Results
Test runs for the NetBench 3.0 NIC test suite were performed with a Group Size of all 974 available network clients. We executed seven consecutive NIC tests, incrementally increasing the Think Time each time. The NIC test results are charted in Figure 2.
Figure 2: NetBench 3.0 NIC test results.
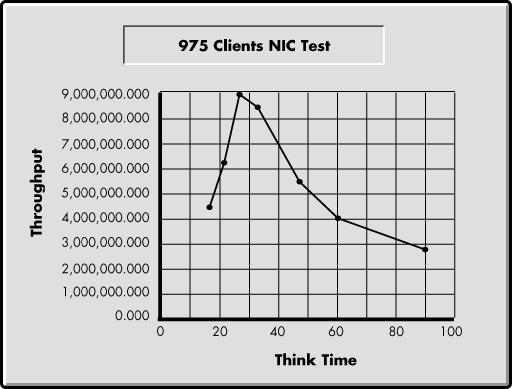
Think Time Variation
The results in Figure 2 reveal the effects of Think Time variation, combined with certain characteristics of Ethernet itself. The left side of the graph shows that for a "short" Think Time of 15 seconds, network throughput is at a moderate level. The most obvious reason is increased contention (collisions) as clients attempt to read and write data from their server directories with shorter pauses between requests. When two clients transmit at the same time on a busy Ethernet network, network packets collide and do not reach their intended destination. (This condition is typically seen when Ethernet utilization rates exceed 25 percent.) Both clients back off and wait for variable lengths of time before attempting to retransmit. During this "wait" time, the clients send no data, causing idle network capacity. As more clients contend for the network, more collisions occur, resulting in lower overall throughput as incremental numbers of clients back off and wait instead of working.
As Think Time increases, each client spends more time "thinking" before sending data to its server directory. There are fewer collisions; consequently, the overall volume of network traffic decreases and we see an increase in total throughput. For our SuperLab test runs, optimum throughput occurred with a client Think Time of 25 seconds.
The right side of the graph in Figure 2 shows what happens when the Think Time becomes too long (for instance, 90 seconds). In this case, clients spend more time "thinking" rather than transmitting, causing intermittent idle periods on the network. This condition also results in lower total throughput.
Network throughput is also affected by other factors, including the types of CPUs and network adapters in the clients, how well network traffic is balanced on the network's LAN segments, and so forth. From our SuperLab data, we can assert that network throughput is limited mostly by the Ethernet protocol, with hardware and software issues playing a much smaller part. Our network utilization monitoring confirms this assumption.
Network Utilization
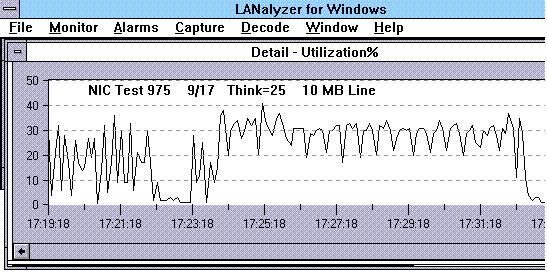
Figures 3 and 4 show LANalyzer snapshots of associated network traffic at the optimal Think Time of 25 seconds. As shown in Figure 3, the 10 Mbps line averaged an "ideal" utilization rate of 25 percent.
Figure 3: Network utilization sample for 10 Mbps segment with Think Time of 25 seconds.
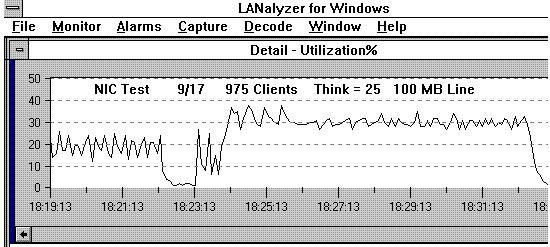
As shown in Figure 4, the 100 Mbps lines averaged a healthy 30 percent utilization.
Figure 4: Network utilization sample for 100 Mbps segment with Think Time of 25 seconds.
LAN administrators should use tools such as the LANalyzer regularly to monitor daily network traffic and identify network traffic growth trends. They can then plan and implement procedures for keeping local traffic at acceptable network utilization levels.
CPU and Bus Utilization
During the NIC tests, we monitored the associated server CPU and EISA bus utilization rates with Compaq Insight Manager. The captured monitor screens are depicted in Figure 5.
Figure 5: NIC test CPU and EISA bus utilization results.
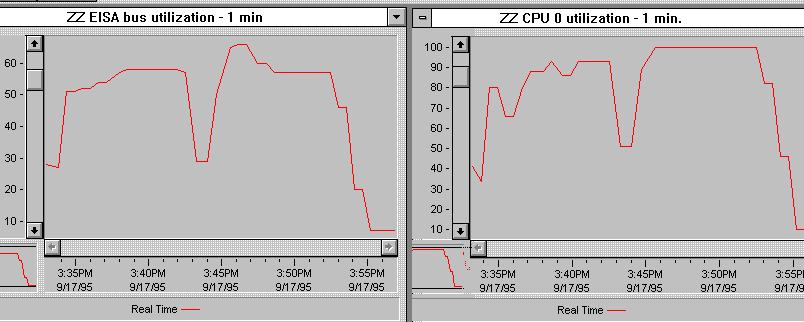
The CPU and EISA utilization profiles remained somewhat constant for all seven NIC tests, with the bus utilization hovering between 50 and 60 percent, and the CPU utilization ranging from 85 to 100 percent. This evidence supports our assumption that the most significant variable effecting NIC test throughput was the network traffic rate. Even with the server's CPU 100 percent utilized, the EISA bus continued to have ample bandwidth available. This test data also supports Novell's statement that when NetWare 4.1's CPU utilization rate is at 100 percent, it does not necessarily mean the server is saturated.
|
Novell articles on high CPU utilization can be found on the World Wide Web at: http://netwire.novell.com/home/server/server.htm, "HighUtilization Information" |
Disk Mix Test Results
The NIC test initiates minimal server-generated activity because it quickly and repeatedly accesses a single, constant, cached file. As we have seen, the Think Time parameter is NetBench 3.0's "network stress throttle." When executing the NIC test, a low Think Time value is needed to control Ethernet utilization.
On the other hand, the Disk Mix test's individual clients are constantly sending requests to read and write to new, unique files accessed from the server's hard drive storage system. Many files must be read off the hard drives and copied into and out of the server's cache memory. The Disk Mix test is thus server intensive, demanding significant activity from the server's CPU and placing a severe burden on the server's disk I/O subsystem. This test is also controlled by the client Think Time parameter. Think Time regulates the rate at which server disk files are needed. Therefore, higher Think Time values are required to run the Disk Mix test.
We executed two series of Disk Mix tests in the SuperLab, each using different Think Time values.
First Disk Mix Test.
The first test series held Think Time constant at 60 seconds, as Test Group sizes increased by increments of 13 clients. Figure 6 depicts the throughput results for the first test series.
Figure 6: Results from the first Disk Mix test series.
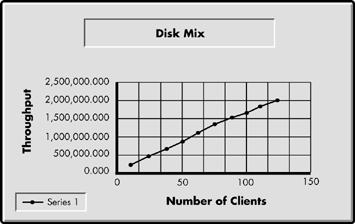
The chart's plotted line reveals that for each run in the test series, throughput continued to increase linearly at an increasing rate. This is a strong indication that the ProLiant 4500 can easily handle network file server requests for increasing demands as more clients come online.
|
Note: In theory one NetBench 3.0 client generates syntheticnetwork traffic equivalent to five or more clientworkstations. Thus, 150 NetBench clients can represent a"virtual network" of 750 clients (150 actual clients 5 "virtual" client traffic rate = 750). |
Figures 7 and 8 present the first Disk Mix test's corresponding CPU and EISA bus utilization data as monitored by CIM. (Note that several CIM console monitor print screen snapshots have been "cut and pasted" together.)
Figure 7: CPU utilization for the first Disk Mix test series.
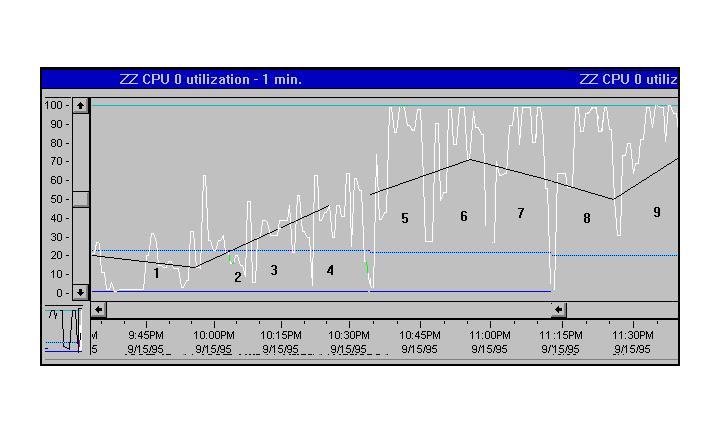
The graph in Figure 7 indicates that the ProLiant's CPU reached a 100 percent utilization rate during the test's fifth run. In subsequent test runs, the CPU utilization continued at this level. Despite the CPU being 100-percent busy on the fifth test point, the EISA bus utilization remained at a healthy level, as shown in Figure 8.
Figure 8: EISA bus utilization for the first Disk Mix test series.
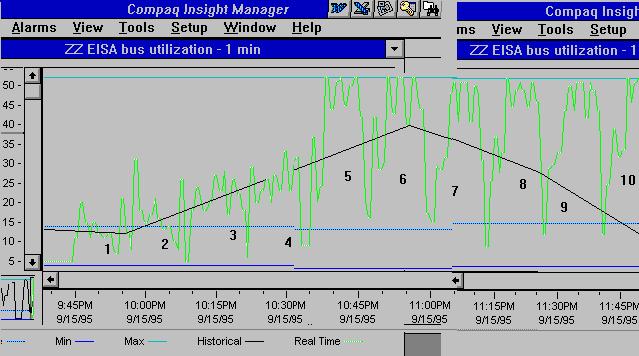
By cross-referencing the throughput graph in Figure 6 with the CIM monitor screens in Figures 7 and 8, we conclude that the ProLiant server is not saturated in test runs beyond the fifth test point. Even though the server's CPU is 100-percent utilized by the NetWare 4.1 operating system, throughput continues to significantly improve as the number of clients (and subsequent network activity) increases.
In addition, the EISA bus utilization stabilizes beginning at the fifth data point, never approaching a point of bus saturation. EISA bus utilization rates associated with the first four data points mainly demonstrate bus overhead. At the fifth data point, economies of scale associated with data transfer are recognized.
Second Disk Mix Test.
Our second Disk Mix test run was a final attempt to determine the ProLiant 4500's maximum capacity and its point of diminishing returns. We figured if we could plot the ProLiant 4500's performance curve's "knee" for the given test conditions, we could locate its maximum throughput.
In the second Disk Mix Test series, we increased the amount of generated network activity for each test run by increasing the client test groups in increments of 81 clients per test run. A conservative estimate for the network traffic generated by the final test run's 406 clients is a "virtual" network of approximately 2,000 clients (406 actual clients 5 "virtual" client traffic rate).
Initial attempts to run the second Disk Mix test with a 60-second Think Time flooded the 10 Mbps LAN segments and pushed network traffic utilization levels beyond their effective range. To "throttle down" test bed network traffic to a level that remained within the acceptable range of Ethernet's capacity bandwidth, we increased the Think Time to 120 seconds. Figure 9 displays the resulting graph for five test runs.
Figure 9: Results from the second Disk Mix test series.
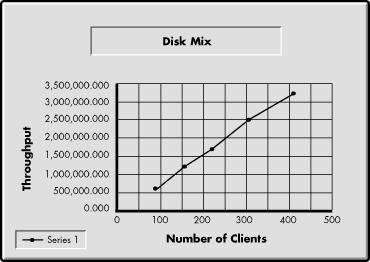
Once again, the second Disk Mix test series displays a steep performance curve, with throughput continuing to increase linearly at an increasing rate. The ProLiant 4500 displayed no indications of server saturation. These results yield a stronger indication for the ProLiant 4500's ability to handle file server requests from very large networks.
The LANalyzer Ethernet line utilization rates portrayed in Figures 10 and 11 are representative of the test's fourth data point (323 clients). With a Think Time of 120 seconds, network activity was lower than in the first Disk Mix test, but remained within a realistic utilization range.
Figure 10: Network utilization sample for 10 Mbps Ethernet segment at the fourth test point.
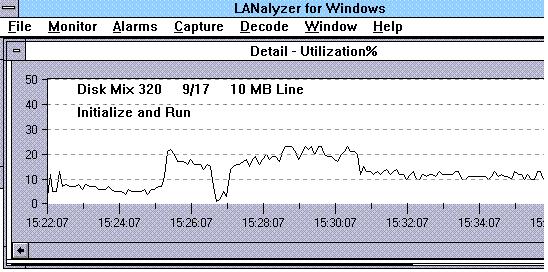
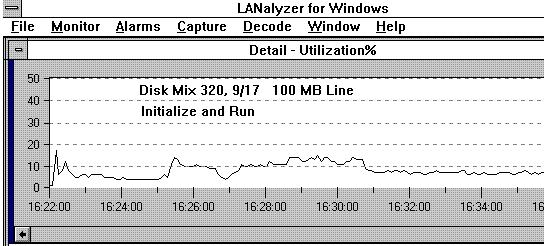
Figure 11: Network utilization sample for 100 Mbps Ethernet segment at the fourth test point.
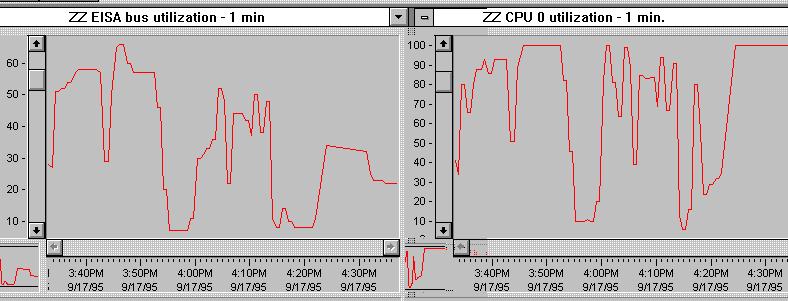
CIM results for the fourth test run indicates EISA bus utilization is at an acceptable level. It is noteworthy that even though the fourth data point's 323 clients "pushed" the ProLiant's CPU to work at the 100 percent level, total throughput continued to increase in the fifth test run with 406 clients, as shown in Figure 12.
Figure 12: Disk Mix test CPU and EISA bus utilization rates for the fifth test run.
CPU Utilization Analysis
During Disk Mix testing, when CIM CPU utilization indicated 100 percent, we periodically checked the NetWare MONITOR.NLM's option for processor utilization details. Here is a breakdown of the processes we typically observed utilizing the CPU:
|
NCP Requests |
25 - 75% |
|
OS Directory Cache Write |
10 - 25% |
|
OS File Cache Write |
10 - 25% |
|
OS FAT Update |
10 - 25% |
|
NetFlex-3 (IRQ 5) |
24% |
|
NetFlex-3 (IRQ 10) |
23% |
|
NetFlex-3 (IRQ 9) |
19% |
|
NCP PacketBurst Polling |
15% |
|
OSMART SCSI (IRQ 15) |
4% |
The majority of the CPU's time was devoted to handling NetWare Core Protocol (NCP) requests and NetWare background processes. However, the ProLiant continued to yield increasing throughput numbers, again confirming that an active CPU is not necessarily an indicator of an overworked server.
At first glance, the CPU utilization rates for the three NetFlex-3 adpaters may appear high. But remember that a 100 Mbps Ethernet adapter operates 10 times faster than a 10 Mbps adapter. If the NetFlex-3 adapters were running in 10 Mbps mode, their CPU utilization rates would have been 2.4%, 2.3% and 1.9%, respectively.
Also note the SMART SCSI Disk Array Controller's CPU utilization rate of 4 percent. The Disk Mix test's heavy disk I/O activity required very little CPU time. Since the SMART controller's on-board processor is managing the bus mastering, it effectively relieves the CPU of the burden of managing file I/O activities.
Conclusions
Our observations of these benchmark tests performed in the SuperLab confirmed many previously held assumptions and demonstrated the capabilities of the Compaq ProLiant superserver in a large NetWare 4.1 network environment. Here is a summary of our conclusions:
NetBench 3.0's NIC and Disk Mix tests provided a "healthcheck" of the SuperLab test bed. The results assured us that the design of the test bed did indeed produce balanced network traffic loads across the LAN segments. Our LANalyzer sampling verified this.
Successful completion of the benchmark tests proved that a ProLiant server running NetWare 4.1 can authenticate and login 974 clients. SuperLab clients came online at anapproximate rate of one client every two seconds. A real-world workforce logging into a ProLiant server at the start of the workday (or after a power outage) should experience similar results.
High-end components used in the ProLiant 4500, such as the NetFlex-3 TX/E network adapters and SMART SCSI disk controllers, demonstrated their ability to be highly stressed without becoming a server bottleneck.
CIM utilization rates indicated that even when the network operating system was keeping the server CPU busy at the 100 percent level, the ProLiant 4500's EISA bus was not overburdened. In all SuperLab test cases, the EISA bus utilization rates remained at healthy levels. Thus high CPU utilization does not necessarily correlate to an overutilized EISA bus.
In a similar vein, the NetBench 3.0 tests demonstrated that high CPU utilization rates do not necessarily mean the network server is saturated. This supports Novell's statements regarding NetWare 4.1 CPU utilization rates.
It appears that the most crucial bottleneck in a large, single-server network is the restrictive usable bandwidth of Ethernet.
Finally, Compaq Insight Manager and Novell's LANalyzer for Windows were found to be effective, complimentary network management tools.
Future Testing
Compaq plans to continue performance testing the ProLiant server family in large network environments. We hope to address the following topics:
At what Client level and Think Time level does the performance curve's maximum throughput "knee" appear?
Can the Ethernet network bottleneck be eliminated by replacing existing hardware with emerging high-bandwidth technologies?
What are the performance effects of adding NetWare SMP to the NetWare 4.1 operating system?
Future test results may be published in Novell Application Notes, as well as in White Papers posted on Compaq's World Wide Web server.
* Originally published in Novell AppNotes
Disclaimer
The origin of this information may be internal or external to Novell. While Novell makes all reasonable efforts to verify this information, Novell does not make explicit or implied claims to its validity.