Inside the NetWare Server's Packet Burst Statistics Screen
Articles and Tips: article
Senior Research Engineer
Systems Research Department
01 Feb 1996
The Packet Burst Statistics screen is an invaluable tool if you perform troubleshooting or performance analysis of NetWare's Packet Burst Protocol. This optional console screen displays server connections that are configured to support Packet Burst, along with their inter-packet gap time and window sizes. The screen also displays 51 internal event counters. This AppNote introduces the Packet Burst Statistics screen and describes its connection statistics and counters. It also gives some tips for optimizing and trouble-shooting Packet Burst connections.
RELATED APPNOTES Nov 93 "Packet Burst Update: BNETX vs. VLM Implementations"
Introduction
The Packet Burst Statistics screen is an optional NetWare 4.1 console screen that allows you to view the internal Packet Burst operations of your NetWare server. The screen is enabled with a SET parameter that can be used at the console or from a remote location using NetWare's remote console (RCONSOLE) utility.
The Statistics screen displays up to 70 Packet Burst connections, along with the window size and interpacket gap (IPG) statistics for each connection. These statistics are useful for optimizing specific client connections and troubleshooting Packet Burst performance problems.
The screen also displays 51 event counters that detail the occurrence of uncommon events during the server's processing of Packet Burst requests. These counters are less useful than the connection statistics, because they're only informational--none of the events requires any action on your part. However, the counters do shed some light on the variety of scenarios the server processes successfully.
This AppNote describes how to activate and interpret the Packet Burst Statistics screen. It then presents several useful strategies for troubleshooting and optimizing Packet Burst connections. This AppNote represents the first documentation of the screen's 51 event counters.
Activating the Packet Burst Statistics Screen
The optional Packet Burst Statistics screen is available on every NetWare 4.1 server, and on NetWare 3.12 and 3.11 servers with Packet Burst enabled. However, some of the event counters discussed in this AppNote are seen only on NetWare 4.1 servers.
You can enable the screen at any time from the server console prompt by typing the following SET parameter:
SET Enable Packet Burst Statistics Screen = ON
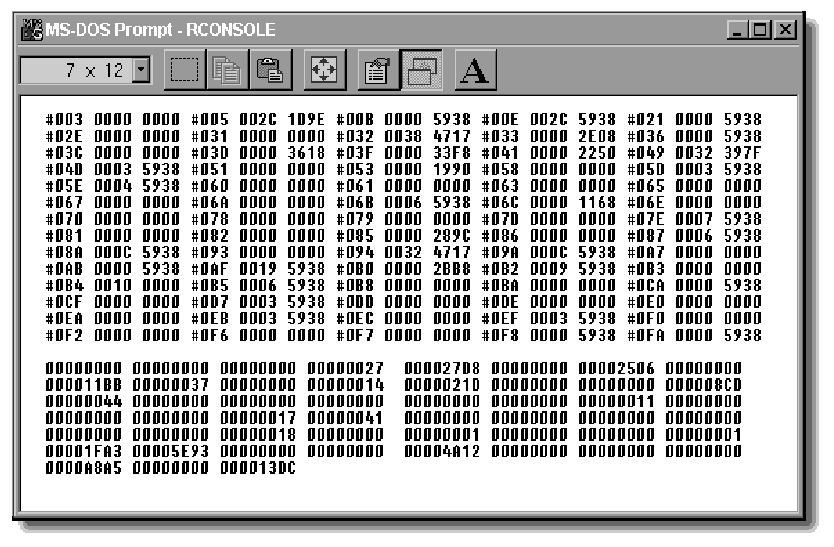
Once the statistics screen is enabled, press <Alt<-<Esc< to cycle through the server's console windows until you find the "NCP Packet Burst Screen" (see Figure 1).
Figure 1: The Packet Burst Statistics screen displays 70 connections and 51 event counters.

We recommend that you not leave this screen running on a production server. While the screen is enabled, the Packet Burst Polling Process loops (once every four polling loops) through the server's connections and Packet Burst statistics counters, reporting all of these statistics to the console. To avoid this unnecessary overhead, you can disable the statistics screen at any time by retyping the SET parameter at the server's console prompt and setting the parameter to OFF as follows:
SET Enable Packet Burst Statistics Screen = OFF
|
Hint: Commands you type at the NetWare server console arestored in the server's command queue so they can berecalled later to save you having to retype lengthy stringsof characters. Once you've enabled the Packet Burst screenby typing the SET parameter, simply press the Up-arrowkey to recall the previous console command at the prompt.Then all you have to do is change "=OFF" to "=ON" andpress <Enter<. |
|
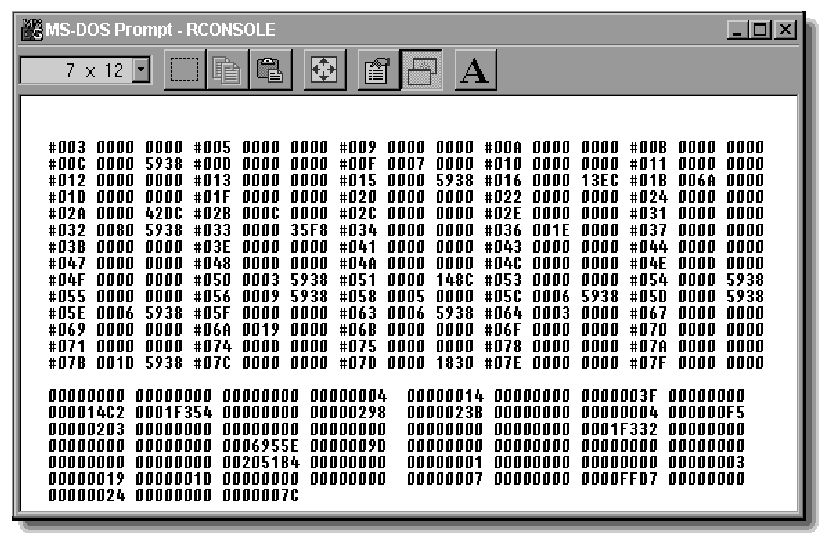
About the Screens The screens in this AppNote are real statics screens from production servers. All of the servers had been up for over 17 days. Each of the servers had different connection counts. Figure 1 is from a server shared byNovell's IS staff with 89 connections. Figure 2 is from a mail server with 357 connections. Each of the screens was collected remotely using RCONSOLE from a Windows 95 client. |
Connection Statistics
When the Packet Burst Statistic screen is active, the operating system's Packet Burst Polling Routine scans the server's connection table for valid Packet Burst connections. The first 70 connections that qualify as NCP connections and have Packet Burst enabled are displayed (see Figure 2). Connections other than NCP connections, those not enabled for Packet Burst, and those beyond the seventieth connection, are not displayed.
Figure 2: The connection statistics portion of the screen displays information about up to 70 NCP/Packet Burst connections.

The upper half of the statistics screen displays the Packet Burst connections using the following format:
#[connection number] [inter-packet gap] [window size]
These three elements are described below.
Connection Number. This is the client's server connection number, displayed in hexadecimal notation. This number is the same as the connection number displayed in MONITOR's "Connection Information" menu option.
Inter-Packet Gap (IPG). This is an intentional delay (measured in ten-thousandths of a second) placed by the sender between each packet of a burst window. This delay is imposed by the client's flow control algorithms to accommodate slow links, congested links, and slow clients. The IPG is automatically adjusted by the client when it first connects with a NetWare server. Thereafter, the IPG is adjusted up or down based on the frequency of dropped packets.
The inter-packet gap is normally below five milliseconds on a fast link with no congestion. On slow or congested WAN links, this same IPG can climb up to one second.
Window Size. This is the maximum amount of data (in bytes) the server may send to the client before an acknowledgment (ACK) packet is expected from the client. The read window size is set in the client's NET.CFG file and remains constant for the duration of the connection. There is also a write window size that can be set in NET.CFG, but this size is not reported on the statistics screen because it does not constrain the server's operation the way the read window size does.
Setting the Read Window Size
The default settings for the two window sizes that can be configured in the client's NET.CFG file are:
Pburst Read Window Size = 16

Pburst Write Window Size = 10
These two parameters can range from 3 to 255, with a maximum resulting window size of 64KB.
Again, the window size reported on the statistics screen is the Pburst Read Window Size set at the client. The default read window size is configured for networks that operate with a 4KB maximum frame size (such as token ring networks). The default of 16 for the read window size, multiplied by the media's 4KB maximum frame size, produces an optimal 64KB burst window (16 4KB = 64KB).
If your network uses a maximum frame size of 1514 (as is the case for Ethernet), the default read window size translates to 5938h or roughly 24KB. In cases such as this one in which the maximum frame size is smaller than 4KB, you may want to consider increasing the Pburst Read Window Size setting on some or all of your clients to create a 64KB window.
To do this, divide 64KB (65,535) by your maximum frame size minus the media and protocol header lengths. Use the result for the Pburst Read Window Size setting in each clients' NET.CFG file. For Ethernet, you would use a value of 45, calculated as follows:
65,535 / (1514 56) = 44.9
Using the NET.CFG parameter "Pburst Read Window Size = 45" on Ethernet clients produces a maximum window size of FAFCh or 64,252 bytes decimal. However, this larger window size shouldn't be used on large, congested networks without first testing its impact.
Troubleshooting with the Connection Statistics
The connection statistics displayed in the upper half of the screen are extremely useful in troubleshooting Packet Burst problems. The following strategies illustrate how to use these statistics to solve performance-related problems.
Determine whether Packet Burst is enabled for a specific connection. If a connection shows up on the statistics screen, you know Packet Burst is enabled. The connection's window size will be zero if the connection is not logged in. Otherwise, the window size displayed is equal to the read window size configured by the client.
Determine whether a connection's flow control is requiring an unusually high IPG. On fast links, the IPG should be less than five milliseconds; zero is optimal. However, periodic congestion can force a client to increase its IPG as a means of flow control. If a fast connection's IPG is higher than normal, check the statistic again during an off-peak period to make certain the client is normalizing its IPG. On slow links, the IPG can be significant.
Determine whether a connection's window size is unusually small. Since the connection's window sizes are set by the client when the connection is created, you can easily check for clients within appropriate settings. Start by figuring your optimal read window size. This may or may not be 64KB, depending on standards within your organization and whether you're allowed to dabble with NET.CFG parameters. Then compare your optimal window size with those reported on the statistics screen. Connections with smaller window sizes are candidates for new settings in their NET.CFG files.
Event Counters
The bottom half of the Packet Burst Statistics screen is reserved for 51 hexadecimal event counters. All of the counters represent uncommon occurrences. However, most of the counters reflect events that, although uncommon, do occur naturally in a networked system. For example, in some cases a series of packets sent by a client will arrive at the server in a different order than they were sent. While this may not be a common occurrence, it does require the server to handle the packets differently from packets arriving in order. It is therefore reported as an event on the statistics screen (see counter 42).
Some of the counters represent error conditions. When these errors occur, they are reported on the statistics screen and handled appropriately. When the server encounters these error conditions, it always recovers gracefully. For example, when the server receives a write fragment before it has received a write request, the server places the write fragment in a hold queue until the mandatory request is received. If the request isn't received within a certain time-out period, the server assumes the fragment was sent in error, removes the fragment from the queue, and discards it.
Some of the counters signal events that should never occur, or occur only under the most unlikely of circumstances. Under normal operating conditions, these counters remain set to zero.
All of the counters are for informational purposes only. None of the counters suggests any action on your part. They are presented here in case you want to perform some troubleshooting or performance testing that requires you to analyze discrete events within the Packet Burst process.
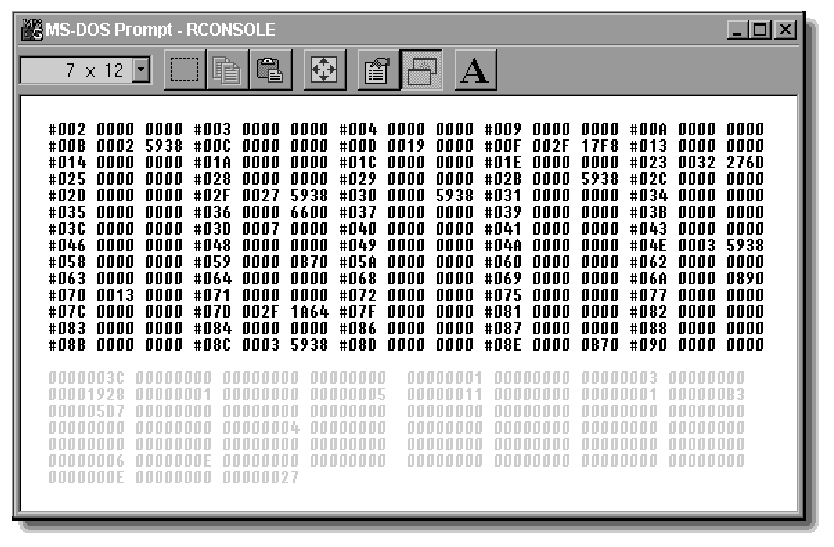
Figure 3: The counters on the Packet Burst Statistics screen provide information on 51 events.

The counters on the screen are numbered from left to right and then from top to bottom, beginning at the top left-hand corner of the counter block.
The table in Figure 4 lists each of the event counters, numbered one through 51, and gives a brief description of the event that causes the counter to be incremented.
Figure 4: Packet Burst screen event counter definitions.
|
Counter
|
Description
|
|
1 |
Number of packets sent by a client with an invalid connection (due to non-existent connection, connection number out of range, or incorrect NCP connection type, for instance) |
|
2 |
Number of packets containing an improper connection ID or an unknown request code |
|
3 |
Number of times the server received an invalid Packet Burst request |
|
4 |
Number of requests received while the server is still transmitting a response to the previous request (This event occurs when the server is congested and a client times out waiting for a response.) |
|
5 |
Number of requests received while the server is still processing the previous request (This event occurs when the server is congested and a client times out waiting for a response.) |
|
6 |
Number of requests containing an invalid request code |
|
7 |
Number of incoming packets containing an invalid message number |
|
8 |
Number of requests received while the requesting client's connection is in the process of being closed |
|
9 |
Number of times a file read was repeated for a client |
|
10 |
Number of times a read error was encountered |
|
11 |
Number of times the server aborted a write request |
|
12 |
Number of times a read request contained an invalid message number |
|
13 |
Number of times the server serviced a duplicate read request |
|
14 |
Number of read requests receiving while the requesting client's connection is in the process of being closed |
|
15 |
Number of times the server received a duplicate control packet. |
|
16 |
Number to times the server received a duplicate request from a client and therefore sent a "hold off" reply because the server was still processing the original request |
|
17 |
Number of times a client requested data that did not exist |
|
18 |
Number of times a client requested an invalid read size |
|
19 |
Number of times the server encountered an asynchronous read error while servicing a read request |
|
20 |
Number of times the server encountered a physical read error while servicing a read request |
|
21 |
Number of times the server encountered a bad write fragment list |
|
22 |
Number of times no data was read while the server was servicing a read request |
|
23 |
Number of times the server received a duplicate write request |
|
24 |
Number of times the server received an acknowledgment when it wasn't anticipating one |
|
25 |
Number of times a write request's length parameters were inconsistent |
|
26 |
Number of times the server received a packet that should have been a write fragment but wasn't |
|
27 |
Number of times the server discarded a duplicate request that didn't require an acknowledgment |
|
28 |
Number of write requests that included an invalid message number |
|
29 |
Number of write requests received while the requesting client's connection is in the process of being closed |
|
30 |
Number of write requests that were aborted due to the connection being closed |
|
31 |
Number of times a client sent a "retry" request after the server sent a "hold off" response to a previous request |
|
32 |
Number of write requests received while the server was in the process of sending an acknowledgment for the previous request |
|
33 |
Number of write requests that included a offset that was out of bounds |
|
34 |
Number of calls to Alloc that failed while trying to allocate an additional write control node |
|
35 |
Number of times a client sent a write fragment that was necessary to complete the pending write request |
|
36 |
Number of times a client's number of write fragments has exceeded the maximum number of possible fragments |
|
37 |
Number of writes that timed out due to an incomplete set of write fragments |
|
38 |
Number of times a client resent part or all of the request back to the server because the client timed out before the server timed out and asked for the missing pieces |
|
39 |
Number of times a client resent part or all of the request back to the server because the client timedout before the server timed out and asked for the missing pieces |
|
40 |
Number of times the Packet Burst Poller removed an out-of-order write because the client's server connection was being closed |
|
41 |
Number of times an out-of-order write was received by the server |
|
42 |
Number of times an out-of-order write was processed by the server |
|
43 |
Number of times the server eliminated a request for more data after finding the data in the out of order writes queue |
|
44 |
Number of times the out-of-order receive buffer was cleared due to too many buffers being checked out |
|
45 |
Number of times the Packet Burst Poller removed an old out-of-order write request |
|
46 |
Number of times the client requested an acknowledgment but didn't require one |
|
47 |
Number of times a write request was canceled |
|
48 |
Number of times more write packets were received than can fit in the existing window |
|
49 |
Number of times an out-of-order write packet was received |
|
50 |
Number of requests received while the requesting client's connection is in the process of being closed |
|
51 |
Number of times a duplicate write request was received due to the client timing out |
* Originally published in Novell AppNotes
Disclaimer
The origin of this information may be internal or external to Novell. While Novell makes all reasonable efforts to verify this information, Novell does not make explicit or implied claims to its validity.