MONITOR.NLM Using MONITOR to Track NetWare 4 Memory Allocation
Articles and Tips: article
01 Apr 1995
Some of the memory statistics reported in the NetWare 4 MONITOR utility can be confusing without the benefit of additional information. Here's an explanation of three MONITOR screens and how they're interrelated.
Initialization
During NetWare's boot process, the operating system allocates just enough memory for its initial code and data pools. The remaining memory is handed over to the cache subsystem. As needed, memory is then allocated from the cache for additional OS subsystem requirements, system NLMs, and other applications.
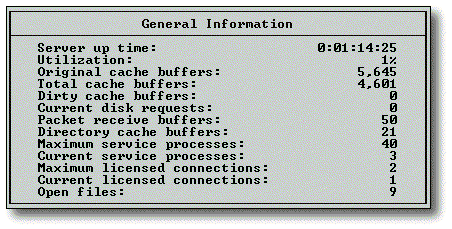
The main MONITOR screen provides some insight into this allocation process. An example screen is shown in Figure 1.
Figure 1: MONITOR's General Information screen.

The two statistics relevant to this discussion are the Original and Total Cache Buffers lines.
Original cache buffers.
This is the number of 4 KB buffers handed off to the cache subsystem during OS initialization. From this total, you can deduce the number of buffers initially required by the OS.
Total cache buffers. This is the current number of cache buffers used by the cache subsystem for file caching. This number will fluctuate as OS subsystems and NLMs allocate from cache, or as free memory is later returned to cache. You can figure the amount of cache memory (in bytes) by multiplying Total Cache Buffers by 4096. Another way is to view the "Cache buffers (bytes)" line item in MONITOR's Server Memory Statistics screen, which is covered next.
Working Memory
After selecting MONITOR's Resource Utilization option, you can access the Server Memory Statistics screen shown in Figure 2. This screen describes how the server is allocating all of its working memory. An explanation of each statistic follows.
Figure 2: MONITOR's Server Memory Statistics screen.

Allocated memory pool. This is the total memory allocated by NLMs using NetWare's memory allocation APIs. This total is broken out in greater detail in the Alloc Subsystem section of this document.
Cache buffers. This is the total memory residing in file cache. File cache is the main pool from which NLM memory requests are serviced. (See "Tuning Cache with the LRU Sitting Time Statistic" in the March 1995 Novell Application Notes for a file cache theory of operations.)
Cache movable memory. This memory is allocated by the OS using an internal API. This memory pool is used for a variety of OS tables including file allocation tables (FATs), directory hash tables, and connection tables.
Cache non-movable memory. This memory is allocated by the OS using a non-movable memory API that is only available to the OS and system NLMs. This API was used in the past because it incurred less overhead than movable memory.
Code and data memory. This is the total amount of memory allocated by the OS for OS code and data, as well as NLM code.
Total server work memory. This is the total amount of memory in the server. In our example, 24,768,512 translates to 24 MB. Divided by 4096, this server has 6144 4 KB pages of available memory.
Alloc Subsystem
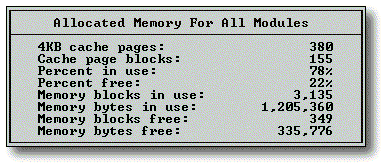
You can use MONITOR's Memory Utilization option to find the Allocated Memory For All Modules screen in Figure 3. (This screen provides more detail about the allocated memory pool you saw listed in the Server Memory Statistics screen in Figure 2.)
Here is an explanation of these statistics.
Figure 3: The Allocated Memory For All Modules screen.

4KB cache pages. This is the number of 4 KB cache pages currently in use by all NLMs. As NLMs request different sizes of memory blocks, the Alloc subsystem services those requests with memory from the cache subsystem in multiples of 4 KB blocks.
Cache page blocks. This is the number of memory blocks made up of multiple 4 KB buffers that have been allocated from the Cache subsystem (4 KB buffers x n). If an NLM requests 5 KB of memory, the OS will allocate two 4 KB cache pages, resulting in one 8 KB cache page block.
Percent in use. This shows the percentage of total Alloc memory currently in use.
Percent free. This shows the percentage of total Alloc memory currently on NLM free lists.
Memory blocks in use. Memory blocks are different from the cache blocks described above. Memory blocks are individual pieces of memory requested by an NLM and can be as small as 16 bytes. If MONITOR followed internal OS nomenclature, these would be called memory nodes rather than blocks. If an NLM requests 1024 bytes of memory followed by three more similarly-sized requests, the NLM would own four 1024-byte nodes.
Memory bytes in use. This represents the total number of bytes in use by NLMs.
Memory blocks free. This represents the total number of memory nodes that reside on the free lists.
Memory bytes free. This represents the total number of bytes of memory on the free lists.
Understanding Discrepancies
You may notice a discrepancy between the values reported in the Memory bytes (in use and free) statistic in Figure 3 and the Allocated memory pool (bytes) value in Figure 2. This discrepancy is caused by some unreported overhead incurred during the allocation process. Part of this unreported memory is used to manage the allocated memory. There is a 16-byte overhead for each node (Memory blocks in use and free) which are the individual pieces of memory requested by an NLM. There is also a 16-byte overhead for each block (Cache page blocks). The remaining unreported memory is allocated by the OS. (In several of our lab servers, this amounted to about 50 KB of RAM. The amount may vary depending on your circumstances.)
Another discrepancy can be caused by NetWare's garbage collection process. Memory involved in garbage collection is unlinked from the free lists and the amount is subtracted from the free list statistics (Memory bytes free, Memory blocks free). However, the memory's return to cache and the subsequent update of the Alloc subsystem's memory statistics may not occur until a later time when the garbage collection process is completely finished returning the memory to the cache subsystem.
* Originally published in Novell AppNotes
Disclaimer
The origin of this information may be internal or external to Novell. While Novell makes all reasonable efforts to verify this information, Novell does not make explicit or implied claims to its validity.